What is a heatmap?
A heatmap is a visual representation of data that shows the areas of a webpage where users are most engaged, helping businesses understand user behavior and optimize their website accordingly.
Are you looking to understand how users browse and interact with your site? If so, heatmaps are an excellent way for you to analyze your audience’s interactions on your website to help you create a better experience for them, specially in 2024. On this page, we’ll answer the question “what is a heatmap,” discuss how to read a heatmap and provide you with three of the best times to use them.
If you need help utilizing heatmap marketing for your business, call us today at 888-601-5359 to speak with a strategist about how we can use heatmaps to help optimize your site.
Time to Level Up Your Sales
Our long list of services helps you grow every aspect of your business with marketing strategies that are proven to increase bottom-line metrics like revenue and conversions.
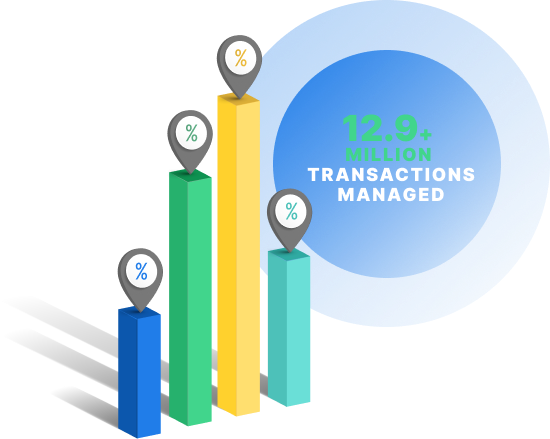
In the past 5 years, we’ve managed more than 14.9 MILLION transactions across our client base.
What is a heatmap?
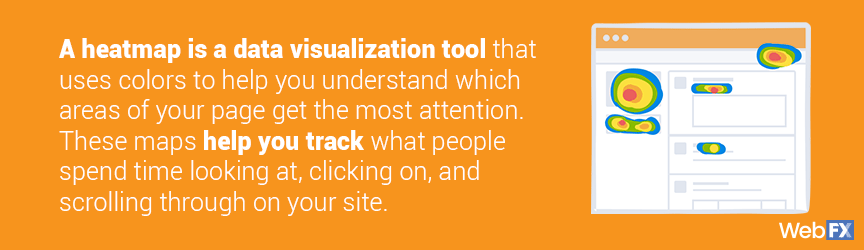
A heatmap is a data visualization tool that uses colors to help you understand which areas of your page get the most attention. These maps help you visually track and understand how users interact with your pages, such as helping you see:
- Which parts of your content get the most attention
- Where people look or click
- How far down they scroll on specific pages of your site
These maps use a warm to cool color spectrum. The warmer end of the spectrum indicates substantial activity, while the cooler end suggests little activity. Since heatmaps give you a clear picture of how users interact and behave on your site, you can position the most relevant content on your page in places your audience looks.
If you keep thinking about what is a heatmap’s relevance, you need to know that these maps are an excellent resource for understanding how users navigate or fail to browse your pages.
If you have a high bounce rate on a particular page, you can use a heatmap analysis to understand why people leave your page.
Learn 8 Steps to Map a Sales Call
3 types of heatmaps to help you understand your audience

There are multiple types of heatmaps you can use to understand page browsing behavior better. Let’s look at three popular maps people use to track online engagement:
- Hover maps: Hover maps show areas where people hover with their mouse most often. These maps focus on the idea of where people hover, they look. While this map type is used frequently, it’s challenging to assume mouse movement indicates looking because some people park their mouse in one place even though they look elsewhere.
- Scroll maps: If you want to know how far down people scroll on your page, this map will tell you. Scroll maps show how far down users scroll and where they tend to drop off. It’s a pertinent heatmap when you’re trying to understand how users engage on long-form pages or longer landing pages.
- Click maps: Click maps focus on areas where users click the most. This heatmap is great for companies that want to see which parts of your page catch your audience’s attention and get them to click.
When creating a heatmap, you can use any of these three formats to help you understand a user’s interaction with your site pages. However, you’ll want to ensure you use the appropriate heatmap for what you want to measure. Now you unveil the question of what is a heatmap, learn how to interpret it.
How to interpret a heatmap to uncover the most important info
Now that we answered the question, “what is a heatmap,” let’s move on to the next most common question: how do I read a heatmap?
Heatmaps are easy to use to analyze and understand the data.
When you use a heatmap, you’ll get both the visualization and the raw data points. When you look at the visual, you’ll see different colors. Areas with red, yellow, and white are high traffic areas or hotspots.
These are places where users often view, hover, or click. Areas with colors like blue and green are low traffic areas, also known as low points. These are areas where users engage the least.
It’s as simple as that!
By knowing what the colors mean, you can look at your heatmap overlaid on your website and see where people engage the most.
When is the best time to use a heatmap?
Now that you know more about heatmaps, you may wonder when you can use them. Realistically, you can use heat maps at any time to gain more insight into user interactions with your website. Let’s take a look at three prime examples of when to use a heat map.
During a website redesign
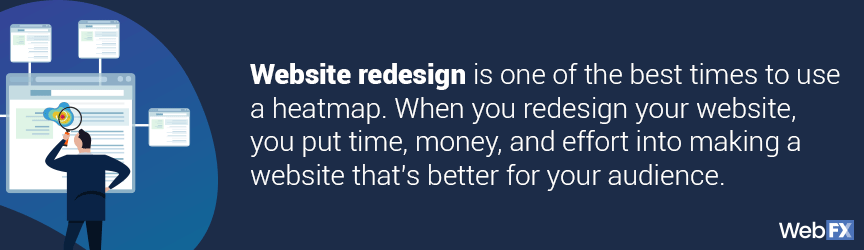
A website redesign is one of the best times to use a heatmap.
When you redesign your website, you put time, money, and effort into making a website that’s better for your audience. A heatmap can help you design a website that works better for your audience. You can use a heatmap to analyze your website’s current state, and analyze different design elements on your website to see how they impact your audience.
For example, you can analyze your call to action (CTA) button to see if it’s engaging your audience and getting them to click.
Let’s say you have the same CTA button in the same position on different pages, but one is yellow, and one is green. By using a heatmap, you can analyze these two pages and see if one color earns more engagement than another. It’s valuable information that helps you make decisions about your new website.
This type of information is vital to know when you’re redesigning a website.
If you partner with a web design agency, they will have the ability to use a heat map to test your current site’s effectiveness. It helps them see what’s working and what’s not, so you can get a website that drives better results for your business.
When you’re testing elements of your site
If you’re conducting tests on different types of marketing materials, it’s a great time to use a heatmap. Heatmaps provide you with valuable data that helps you see how users interact with your content.
Let’s take a look at two common instances where you can use heat maps to help with testing.
1. Advertisements and landing pages
If you’re running a display ad or pay-per-click (PPC) ad, you can use heatmap testing to analyze your ad’s effectiveness. With display ads, you can test different elements on your site to see which ones garner more engagement. You may test changing the color of your button or the person in your photo.
A heat map will help you compare the two display ads to see how these changes cause people to click in different places.
If you’re running a PPC ad, you can use heatmaps to test your landing pages. You put up two different versions of your PPC ad to see which one garners the most engagement and gets people to click on the right buttons or look at the right information. It can be a small test, like changing the direction a person faces in your ad.
In one version, you may have them face forward, while the second version has them facing the text. With a heat map, you can see if the position of the person changes how users read the information on your landing page.
2. Website pages
An important part of your site is usability. You want users to easily browse and navigate through your site. With heat maps, you can analyze changes on your site to see how they help or hinder usability.
You could test to see if changing the location of your Call-To-Action (CTA) gets more people to take the next step, or if using more visuals gets people to scroll further down your page. You can test different elements on your website to see if it creates a better experience for your audience and keeps them engaged on your pages longer.
3. Content marketing
Content marketing helps you provide your audience with valuable knowledge. One of the most popular forms of content is written content. From blog posts to guides, many companies write these pieces of content in hopes of engaging and informing their audience.
With heat mapping, you will understand how users engage with your content. It’s one of the best times to use a heatmap because you’ll know if your content engages your audience and grabs their interest.
When gauging the engagement and interest of users in your content, you can gauge how interested and engaged users are in your content with the scroll heatmap. It helps you see if there are specific points of interest that your audience spends more time on, or if they skim the majority of the article and don’t get to the end.
A heatmap will help you understand how to create better content for your audience. You will see what gets your audience to scroll mostly all the way through your page, so you can create content that resonates with your audience.
We don’t want to tell you about the work we do, we want to SHOW you.
View Our PortfolioWe’ve built over
Websites
in a variety of industries.
Want to create a better website for your audience? Heatmaps can help!
Heatmaps are a valuable tool at your business’s disposal, specially in 2024.
You can use these maps to help you create better pages for your audience. It’s a useful analysis tool for developing ads, pages, and websites that have a significant impact on your audience.
If you aren’t sure how to get started with heatmap marketing, WebFX can help. We have a team of over 500 experts that can help you analyze heatmaps and adapt your pages to make impactful changes.
We’ll help you optimize your webpages and ads to increase engagement with your audience. Ready to learn more about heatmaps? Contact us online or call us today at 888-601-5359 to speak with a strategist.
-
 Macy is a marketing writer with over five years of experience creating content for dozens of industries including food and beverage, home services, and education. She also specializes in creating SEO and PPC content. Her work has been featured by Search Engine Journal, HubSpot, Entrepreneur, Clutch, and more. In her free time, Macy enjoys trying new crafts and reading comic books.
 -

WebFX is a full-service marketing agency with 1,100+ client reviews and a 4.9-star rating on Clutch! Find out how our expert team and revenue-accelerating tech can drive results for you! Learn more
Try our free Marketing Calculator
Craft a tailored online marketing strategy! Utilize our free Internet marketing calculator for a custom plan based on your location, reach, timeframe, and budget.
Plan Your Marketing Budget
Share this article

Maximize Your Marketing ROI
Claim your free eBook packed with proven strategies to boost your marketing efforts.
Get the GuideTry our free Marketing Calculator
Craft a tailored online marketing strategy! Utilize our free Internet marketing calculator for a custom plan based on your location, reach, timeframe, and budget.
Plan Your Marketing Budget