
If you run PPC campaigns with Google Ads, formerly called Google AdWords, you know that quality score plays an important role in how much you pay for clicks and your ability to reach new leads. But up until recently, viewing and analyzing the factors that played into your quality score was a cumbersome task. Fortunately, Google announced in May that they were adding more quality score insights columns to Google Ads and making it much easier for marketers to monitor and improve their campaigns.
If you haven’t yet taken advantage of this expanded data, keep reading to learn how to access it, and how to use this information to improve your campaigns.
How to access your quality score data
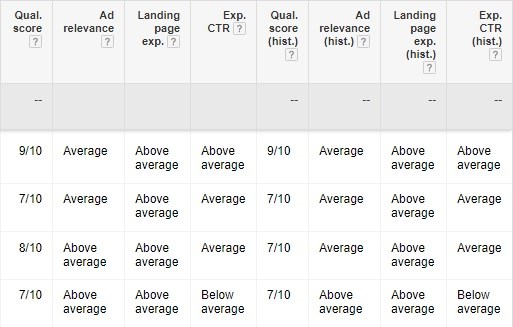
Up until May, advertisers could hover over their quality score for each keyword and see its performance (below average, average, or above average) in the three factors— expected click-through rate (CTR), ad relevance, and landing page experience. Only one keyword’s quality score factors was visible at a time, making it difficult to get a big-picture idea of which factors impacted a campaign the most. Now, advertisers can add columns to their reports for each of these metrics.
They can also add “historical” columns that show each keyword’s performance over a given time range with data starting on January 22. You can access this data by open a campaign in Google Ads, navigating to Keywords > Columns, and selecting “Quality Score” in the left column. Then, you can select which columns you want to appear in your reports. 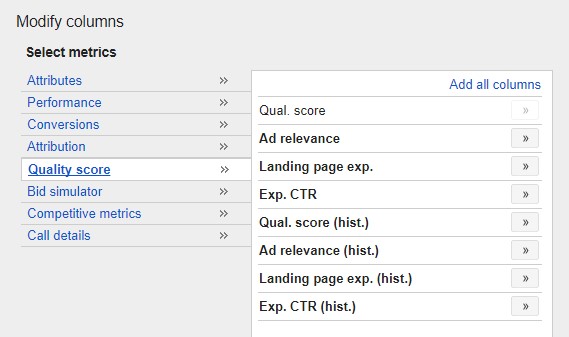 Once you navigate back to your reports, you’ll see all of this data in one place.
 You can also apply the “Day” segment to your reports to view historical data for any set of days in your campaign. You can export this information into an Excel sheet with the rest of your campaign metrics — which is the biggest advantage for data-focused marketers — and work with the data however you’d like.
How to use the new insights to improve your campaigns
Much like other analytics, quality score data is only valuable if you use it to improve your campaigns. So what can you do with the advanced quality score insights?
1. Take a comprehensive look at your scores
Before these features, you’d have to hover over individual quality scores to see what was affecting them. Now, you can see all of this information at once, making it much easier to identify weak spots in your campaign. So if you have “below average” landing page experience scores across the board for a specific campaign, you can visit that page and figure out what’s causing the issue.
If you have “above average” landing page scores for another campaign, you can examine that page and see what you’ve done differently. Then, you can use that information to update your landing pages for the rest of your ads.
2. Use historical data to evaluate changes
The addition of historical data makes it easier than ever to evaluate the changes you’ve made to your campaigns over time and see how they’ve impacted your quality score. This is especially helpful if you set the date range to whenever you made changes to your campaign. Then, you can apply the “Day” segment to your report.
This lets you see the quality score for individual days within that range. 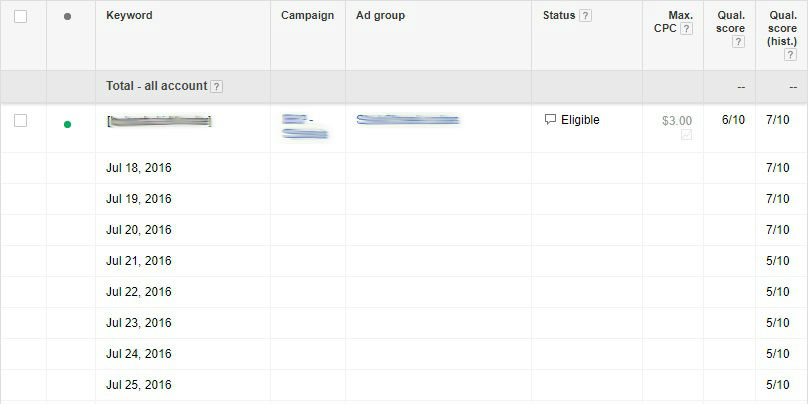 In this case, the quality score dropped from 7/10 to 5/10 on July 21 – meaning that whatever change was made around that time had a negative impact. Using that information, you can determine what the change was and take steps to restore the ad’s previous score.
For example, if you changed the landing page for the campaign, you’d want the updated page to be consistent with your ad copy, then check it for other issues like page speed and mobile-friendliness. You can also select longer date ranges and segments to see how your scores have changed over time. Ideally, you’ll see an upward trend.
If not, you have more data than ever to help you make that happen.
Have you made any changes based on the new quality score insights?
If you’ve found any other ways to utilize this new data, let me know in the comments below!
-
 Trevin serves as the VP of Marketing at WebFX. He has worked on over 450 marketing campaigns and has been building websites for over 25 years. His work has been featured by Search Engine Land, USA Today, Fast Company and Inc.
 -

WebFX is a full-service marketing agency with 1,100+ client reviews and a 4.9-star rating on Clutch! Find out how our expert team and revenue-accelerating tech can drive results for you! Learn more
Try our free Marketing Calculator
Craft a tailored online marketing strategy! Utilize our free Internet marketing calculator for a custom plan based on your location, reach, timeframe, and budget.
Plan Your Marketing Budget
Share this article

Looking for More?
Get expert ideas, industry updates, case studies, and more straight to your inbox to help you level up and get ahead.
"*" indicates required fields
Try our free Marketing Calculator
Craft a tailored online marketing strategy! Utilize our free Internet marketing calculator for a custom plan based on your location, reach, timeframe, and budget.
Plan Your Marketing Budget