 Most websites load reasonably fast when visited by their average number of users. However, performance rapidly deteriorates when a site is overwhelmed by peak traffic (the times when the site’s traffic is the highest) and during traffic spikes. In a quest to learn about the art and science of peak traffic estimation, I began to study some publicly available data to see if I could try to discover a connection between peak traffic and the average traffic of a website, as well as the type of traffic it can receive.
P.S. Curious about your site’s traffic?
Try out our free Website Traffic Checker for free right now!
Summary and Data
Data for peak and average site traffic analysis came from Quantcast. Here is a typical traffic chart from Quantcast: 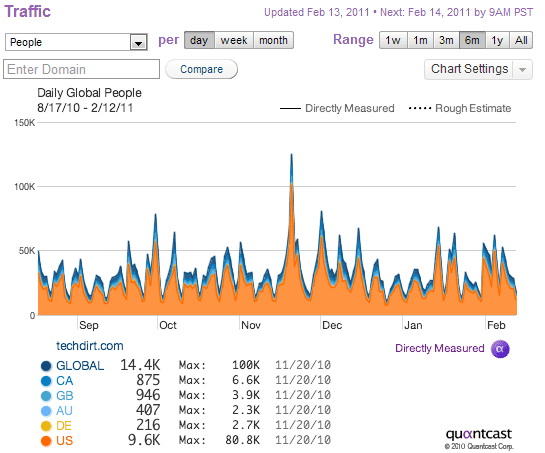 For the purpose of this study, we will only look at traffic data from the US. We also obtained the average and maximum daily traffic over a 6-month period.
This data was first retrieved on February 12, 2011. Only MRC accredited data was used. The following summarizes the data obtained.
High-Ranking Websites (About 400,000 Visitors Monthly)
| Rank | URL | Monthly visitors | Average daily visitors | Maximum daily visitors | *Factor |
|---|---|---|---|---|---|
| 4,988 | collegecandy.com | 409,400 | 13,647 | 61,700 | 5 |
| 4,912 | myplick.com | 415,400 | 13,847 | 39,900 | 3 |
| 4,908 | djbooth.net | 415,600 | 13,854 | 29,500 | 3 |
| 5,009 | wndu.com | 407,500 | 13,584 | 104,000 | 8 |
| 4,937 | joycemeyer.org | 413,600 | 13,787 | 53,000 | 4 |
| 4,978 | mapmyrun.com | 410,200 | 13,674 | 50,600 | 4 |
| 4,964 | techdirt.com | 411,700 | 13,724 | 80,800 | 6 |
| 5,010 | curezone.com | 407,400 | 13,580 | 18,700 | 2 |
| 5,072 | stupidvideos.com | 403,000 | 13,434 | 25,300 | 2 |
*Factor is the maximum daily visitors divided by the average daily visitors. Notice that the maximum daily visitors are 2-8 times higher than average daily visitors.
This is from monthly traffic in the 400,000-visitors range.
Middle-Ranking Websites (About 190,000 Visitors Monthly)
| Rank | URL | Monthly visitors | Average daily visitors | Maximum daily visitors | *Factor |
|---|---|---|---|---|---|
| 9,938 | koinlocal6.com | 195,300 | 6,510 | 56,400 | 9 |
| 9,943 | charitynavigator.org | 195,300 | 6,510 | 28,900 | 5 |
| 9,948 | fivestaralliance.com | 195,200 | 6,507 | 10,400 | 2 |
| 9,952 | justapinch.com | 195,100 | 6,504 | 12,600 | 2 |
| 9,967 | futilitycloset.com | 194,800 | 6,494 | 26,300 | 5 |
| 9,969 | profootballweekly.com | 194,800 | 6,494 | 21,700 | 4 |
| 9,973 | schaeffersresearch.com | 194,700 | 6,490 | 22,900 | 4 |
| 9,978 | temptalia.com | 194,600 | 6,487 | 19,100 | 3 |
| 9,916 | clatl.com | 195,900 | 6,530 | 18,300 | 3 |
| 10,155 | famoushookups.com | 191,200 | 6,374 | 62,900 | 10 |
Note that at this traffic range, maximum daily visitors are now 2-10 times higher than average daily visitors. Monthly traffic that each site received was about 190,000.
Lower-Ranking Websites
| Rank | URL | Monthly visitors | Average daily visitors | Maximum daily visitors | *Factor |
|---|---|---|---|---|---|
| 19,895 | miamiandbeaches.com | 89,900 | 2,997 | 5,100 | 2 |
| 20,146 | michaelmoore.com | 88,700 | 2,957 | 110,000 | 38 |
| 17,722 | talenthouse.com | 103,200 | 3,440 | 88,300 | 26 |
| 19,996 | nmh.org | 89,500 | 2,984 | 6,100 | 3 |
| 20,025 | campusgrotto.com | 89,300 | 2,977 | 7,400 | 3 |
| 19,920 | times-standard.com | 89,800 | 2,994 | 16,200 | 6 |
| 20,181 | slantmagazine.com | 88,500 | 2,950 | 6,700 | 3 |
| 19,904 | ldoceonline.com | 89,900 | 2,997 | 8,600 | 3 |
| 19,763 | yipit.com | 90,600 | 3,020 | 13,200 | 5 |
| 20,173 | pregnancyguideonline.com | 88,500 | 2,950 | 6,500 | 3 |
You may notice that maximum daily visitors are greater than average daily visitors by a factor between 2-38 times. The variance has thus increased dramatically.
A simple explanation would be that higher-ranking sites with high average monthly visitors are less likely to be affected by sudden surges in traffic. Large sites like CNN, TechCrunch and Mashable have high, stable visitorship, and the impact of a popular news story such as protests in Egypt or a new Apple product would be much lower as compared to a site with low average visitorship. On the other hand, a site like michaelmoore.com can be flooded with traffic if a particular piece of news about the site owner becomes viral.
Let’s take a closer look.
Three Types of Traffic Patterns
There are three main types of traffic patterns.
High Stable Increasing Traffic
WordPress.com has high stable traffic of 44.1 million monthly US visitors. It has a peak daily traffic of 2.2 times of its daily average traffic. 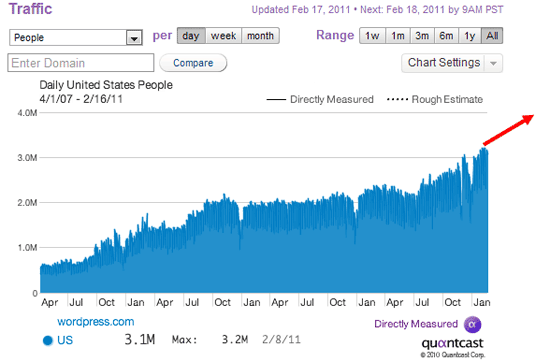 Extrapolation of the rising trend puts their estimated peak daily traffic to be about 4 million by June 2011.
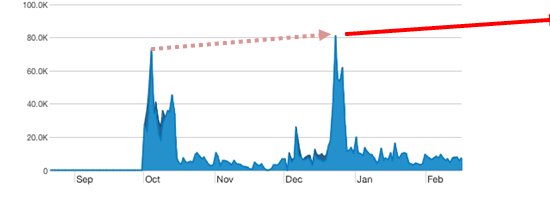
Seasonal Peak Traffic
Some sites experience spikes in traffic due to seasonal promotion or normal business cycles.
Let’s take a look at data from Holidays Central. 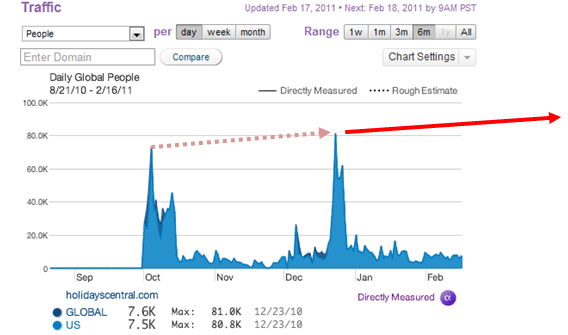 Notice that there is seasonal peak traffic. In this case, we can estimate based on past data, but we need to also factor in growth in traffic.
Low Stable Traffic
Let’s take a look at the chart for michaelmoore.com.
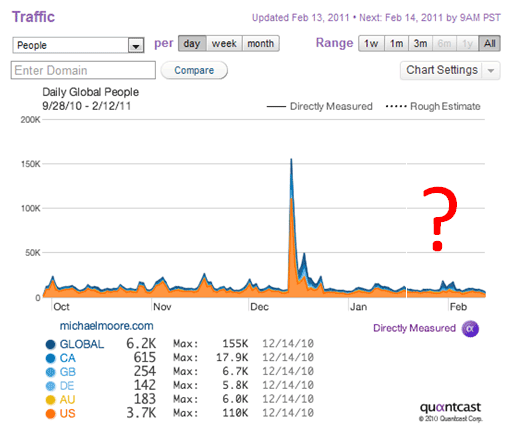 On December 14, 2010, Michael Moore decided to contribute $20,000 to Julian Assange’s bail, resulting in a lot of press, which coincides with the drastic spike in the site owner’s website traffic. This news was reported on major news channels, causing traffic to spike 38 times higher than normal.
Defend Against Sudden Traffic Spikes
It is always hard to predict peak traffic for sites like michaelmoore.com because there is always a possibility that some of its content becomes viral.
According to Scott Galloway, Clinical Associate Professor of Marketing at NYU, there are 3 elements of viral content:
- Authenticity
- Humor
- Social Debate
In Michael Moore’s case, we can see these elements coming into play. What is interesting, though, is that most of the time, going viral normally catches people by surprise. They are not prepared for sudden fame.
Neither are their websites. Imagine your website being hit with 100,000 visitors in an hour — you should be overjoyed, right? But many site owners actually have a bad experience because the site is slow or unavailable.
If your website falls into the category of having low, stable traffic with the chance of going viral, you should not hesitate to estimate that your requirements would be more than 30 times your average traffic.
Controlled Traffic Spikes
Besides being viral, normal marketing and promotion can also cause a spike in traffic. As a site owner, this traffic spike should be more predictable to you and is more likely to happen than accidentally achieving viral site traffic levels. For example, the site completebody recently did a Groupon promotion.
This resulted in a traffic spike from 150 regular daily visitors to 7,000 in one day. That is more than 46 times more than the normal traffic. 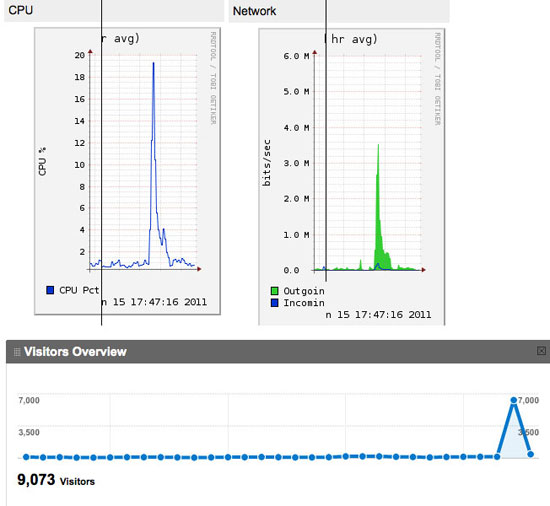
Conclusion
We can follow these guidelines for estimating peak traffic:
- If you do not have prior peak traffic data, if your site has low visitorship, and has content that could go viral, account for peak traffic that can be up to 30 times your average daily traffic.
- If your site has high and stable visitorship, peak traffic can be up to 5 times your average daily traffic.
- If you have prior peak traffic data and timing of peak traffic is predictable (seasonal traffic and controlled traffic spikes), use past data and add a percent growth in traffic to arrive at the final number.
Developers and website owners should determine their site’s capacity by using load-testing tools such as Load Impact (full disclosure: I work for Load Impact) to simulate traffic to their website. That way, they will be able to understand how the website performs under high traffic and tune the website before peak traffic arrives.
Related Content
- 8 Excellent Tools for Optimizing Your Images
- The Three Golden Rules of Site Redesigns
- 15 Tools for Monitoring a Website’s Popularity
-
 President of WebFX. Bill has over 25 years of experience in the Internet marketing industry specializing in SEO, UX, information architecture, marketing automation and more. William’s background in scientific computing and education from Shippensburg and MIT provided the foundation for MarketingCloudFX and other key research and development projects at WebFX.
 -

WebFX is a full-service marketing agency with 1,100+ client reviews and a 4.9-star rating on Clutch! Find out how our expert team and revenue-accelerating tech can drive results for you! Learn more
Make estimating web design costs easy
Website design costs can be tricky to nail down. Get an instant estimate for a custom web design with our free website design cost calculator!
Try Our Free Web Design Cost Calculator
Share this article


Web Design Calculator
Use our free tool to get a free, instant quote in under 60 seconds.
View Web Design CalculatorMake estimating web design costs easy
Website design costs can be tricky to nail down. Get an instant estimate for a custom web design with our free website design cost calculator!
Try Our Free Web Design Cost Calculator