In this article, we’re going to delve into Google Analytics and start to tailor your account settings so you can get information you need much more easily. Google Analytics in Depth is my series of Google Analytics articles where we will explore Google Analytic’s beneficial features to help you get the most out of this powerful and free web tool. This tool is the backbone of any SEO campaign so these tutorials should help you make the most of it.
In this first installment, we’ll be covering Goals and Funnels. For a general overview of site analytics revolving around Google Analytics, read Unleashing the Power of Website Analytics and this guide of Google Analytics terminology. 
Defining Your Goals
Setting up goals in Google Analytics is the best way to measure the success rate of your website.
The easiest way to understand what goals are in Google Analytics is by discussing it with an example: ecommerce sites. An example of an ecommerce site would be an auto parts retailer. The aim of ecommerce sites is to sell goods to their visitors.
Therefore, a completed goal would be a successful sale on their website, such as the sale of an exhaust for the auto parts store. This example hints at the first part of using the Goals feature in Google Analytics: defining what your site goals are.
- What do you want to measure?
- What are the factors that determine the success of your website?
- Are you after sales?
- Are you wanting to generate enquiries from prospective clients that want to hire you?
- Or do you simply want visitors to click around and spend more time on your site reading articles?
Once you know your goal (or goals), you need to work out how they will be measured. For most sites, this will mean either identifying a specific goal completion page (or creating one). For example, an ecommerce site might set up their “order confirmation” page as their goal, because this page usually comes right after a finished sale.
If you’re after client enquiries, then how about the page that is shown to users when they successfully send a message with your web form?
Adding a Goal in Google Analytics
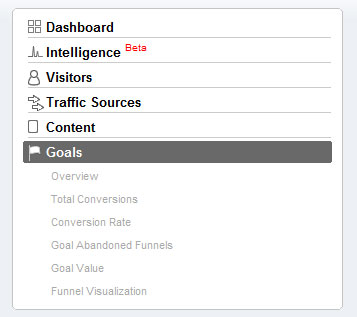 If you haven’t added a goal yet, clicking on Goals in the left hand menu will show you a page that gives a brief overview of what Goals and Funnels are. At the bottom, click on the set up goals and funnels link to get started.
 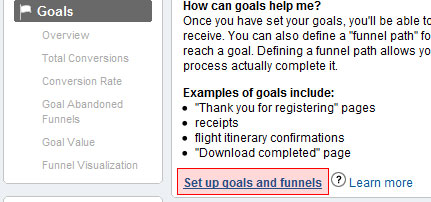 The second box after the Main Website Profile Information section will allow you to set up your conversion goals.
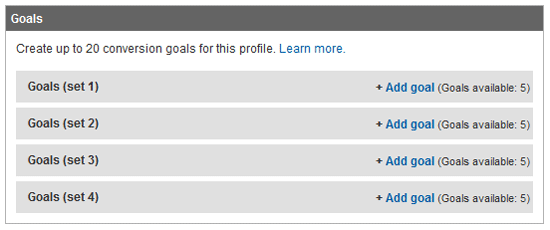
You can group your goals together with goal sets, but to start, we’ll just look at setting up one basic goal. Click on the Add goal link on the left, preferably on Goals (set1). After doing that, you’ll be faced with the Goal Settings page.
 Give your goal a name, make it active, and then choose a position; Set 1, Goal 1, for example, refers to your first set of goals, with “Goal 1” indicating that it’s your primary goal.
 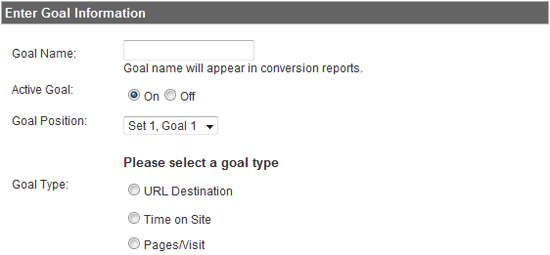 You will then have three types of goals to choose from. When you choose a Goal Type, you will be shown a section called Goal Details, which are settings of your goals.
URL Destination
URL Destination is the most common option and is used when visitors get a specific page to visit.
For example, a completed checkout page in an ecommerce site. 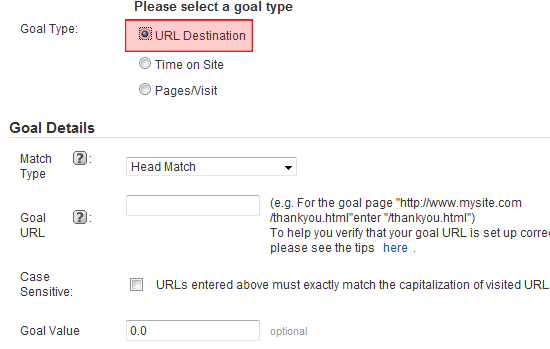
Time on Site
The Time on Site goal type will track users who spend either more or less than a specified amount of time on the site. 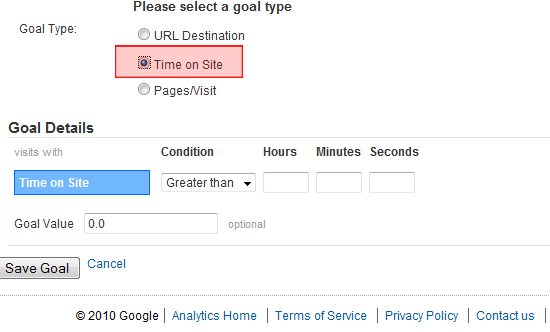
Pages/Visit
Pages/Visit keeps track of people who visit more than, less than or an exact number of pages on the site.
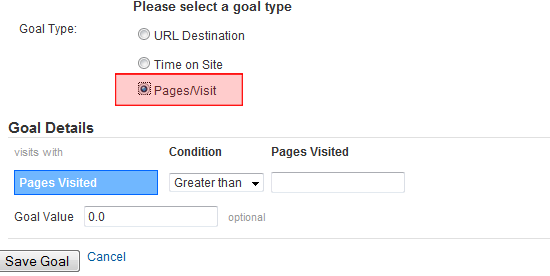 Time on Site and Pages/Visit only give you a single option aside from setting the goal and that is goal value.
Goal Details
For each goal type, there are certain goal details that you can set to customize your goal.
Goal Value
All three goal types have the Goal Value option. It is a monetary return that you estimate a completed goal to be worth; this is normally worked out as part of a website marketing strategy or review. As an example, if a website enquiry, on average, gives a return of $10, then you should set the goal value to $10. In most cases, this is just an estimate, so if you’re not sure, you can set the Goal Value to 0. In the case of ecommerce sites where a completed checkout is worth a variable amount, you can set the goal value to your average basket value. If you’ve set up Time on Site or Pages/Visit as your goal type, you’re now done and you can click the Save Goal button. If, however, you’re setting up a URL Destination as a goal type, read on.
Match Type
The Match Type goal detail has three options: Head Match, Exact Match, Regular Expression Match.
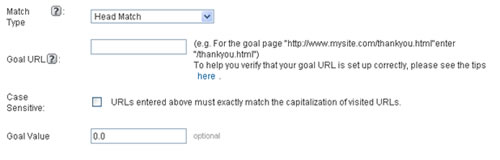 Which one to use will depend on how much variety there is in the URL or your goal page. Head Match: If your goal page requires variables in the URL that can change, such as
 /checkout/?page=1&basket=50036, then using Head Match will match the starting string of the URL (/checkout/). Exact Match: If your goal page is a static URL that doesn’t change, such as /contact/thanks.php, for example, then you’ll want to go for Exact Match.
Regular Expression Match: If it’s likely that the start of the URL could change, then you should use Regular Expression Match; this is useful with URL cases such as /department1/checkout.php and /department2/checkout.php. That’s it for Goals in Google Analytics—let’s move onto Funnels.
Setting up funnel
What are funnels? For certain goal pages, there is a set route of pages that users must go through to get to your goal page.
Let’s take a typical checkout process on an ecommerce site as an example: You add something to the basket, enter your shipping details, add your payment details, and when you submit your order, you get a confirmation page (which is your goal page). This path is known as a funnel process, and by tracking people’s progress through a funnel, you can see where there are problems and where people are leaving the process. This is most often used for checkout processes to see where people are dropping their shopping cart baskets.
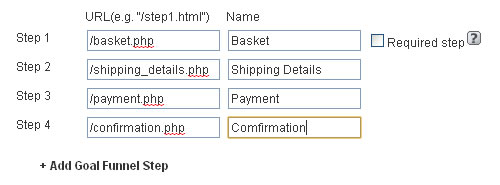
Funnels highlight problems with a long-winded checkout procedure. Firstly, you need to map out the pages of your process. For example, your checkout process might have these pages:
basket.phpshipping_details.phppayment.phpconfirmation.php
 Once you’ve determined your funnel, it’s time to review your goals.
Reviewing Goals
So your goals are all set up, now how do you actually find out information from them? You can see your goal data straight from the Sites Overview page. Under the headings you’ll see a completed goals column which gives you a basic, straightforward figure that is excellent for a quick glance.
But let’s have a deeper look. Note: A quick thing to highlight is that whilst you can look at visitor numbers for the current day, you’re unlikely to get goal conversions in Google Analytics for the current day, at least not reliably anyway. This is because Google Analytics refreshes its data at regular set intervals, so it is better to look at data from the days before the current day.
The basic goal page, which is obtained by clicking on Goals on the main left-hand menu, provides the immediate information you need at your fingertips. You’ll see the standard Google trend timeline and the breakdown of how many visitors completed which goals—this is more useful when you have multiple conversions set up. You’ll then get the conversion rate and the goal value if you’ve entered a value for a conversion.
All these are fairly straightforward and the goal conversion figure is the one that most people will tend to concentrate on and quote, especially with ecommerce websites. So moving down the left hand side, you now have a number of extra menu options that we’ll look at in turn.
Total Conversions:
This shows the total number of conversions and breaks it down by day for the period you’ve selected. This gives an easy visual comparison of better performing days and can help identify trends – do you get more conversions on weekends, maybe?
Conversion rate:
This looks the same as total conversions, right?
Well, it is similar, and on sites that don’t have massive differences in traffic from day to day, they’ll look almost identical. However, where the total conversions page was based on the number of conversions per day, 40 conversions being larger than 10, for instance, conversion rate is based on the number of conversions as a proportion of the total visits for that day. So 40 conversions out of 120 is a rate of 25% – 10 out of 20 is 50%, so the weighting now changes.
Goal Verification Path:
This will list all the pages a completed goal was carried out on.
If you’ve used an absolute path (e.g. /contact/thanks.php) they should all be the same. But if you’ve used a head match and the end of the URL varies, then this will show which URL each goal conversion comes from.
For example: if you have a shopping cart and the end of the URL is just the cart id, it won’t be much use as they’ll all be different, but if you have something more meaningful in the URL—lets say the source of the site visit or conversions on different sub domains—then it can become useful. If you have golf.shop.com/finished and football.shop.com/finished, you can quickly compare where your conversions are happening.
Reverse Goal Path:
This data point shows the pages people landed on leading up to a completed goal. This is useful for seeing which pages are funneling more conversions, and for those results showing (entrance), which landing pages are funneling those conversions.
So as an example, we have thanks.php set as our conversion:
- (entrance) >
index.php>contact.php>thanks.php
This shows that the visitor landing on the homepage went next to the contact page and then completed a conversion; you can quickly see which pages funnel in more conversions and easily start to work out which pages are more successful to understand how you can improve other pages.
Goal Value:
If you have various goals set up with different values, you can use this page to quickly see which days are more profitable and then use other tools to dig down into why.
Goal Abandoned Funnels:
This page gives you an overview of the number of people who enter the goal conversion funnel, but exit without completing a goal. You can quickly see how many potential conversions your site is losing and again compare over the time period you have selected. 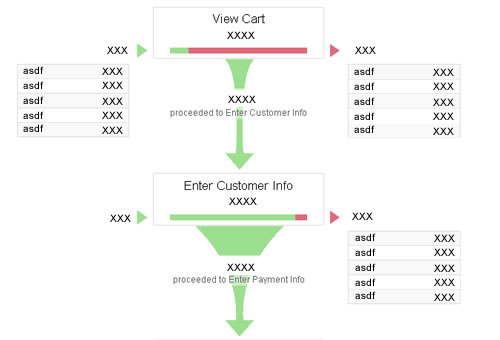
Funnel Visualization:
Once you open up this page, it is self-explanatory: the usual timeline chart at the top of the page and then a flow diagram through the funnel you set up.
At each stage, you can see how many people enter at that stage, how many people are continuing in the funnel from the previous stage, how many people leave at that stage without completing, and perhaps most importantly, where they are going. This is hugely useful for analyzing things such as checkout processes and seeing where users abandon their shopping carts and where they go. For instance, if you have the first stage as the shopping basket, it wouldn’t be too alarming to see people exiting from there to continue browsing the site.
But if they’re exiting all together, maybe something on the shopping cart page is making them drop from the process? You can then look and see where people are dropping out and this can easily highlight problematic or broken forms and links or long-winded pages that people simply give up on.
Drilling down even further
The basic pages give you a very useful set of tools to analyse your conversions and abandonment, however, if you want an extra level of detail, the advanced segments tab can provide some very handy information. Located in the top right of the page just above the trend graph and date picker, it will open up a drop down with a list of visitor types.
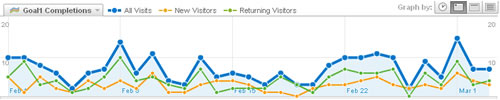 Selecting them via the tick box will show the relevant figures on the page and allow you quickly compare visitor types. Are conversions for new visitors higher than returning visitors? Do people who arrive via paid search (Adwords) abandon more carts than those who arrive by organic search?
These are some of the questions that you can answer by using Google Analytics.
Related Content
- How to Increase Conversions on any Website in 45 Minutes
- 10 Promising Free Web Analytics Tools
- Unleashing the Power of Website Analytics
- Related categories: Tools and Web Development
-
 President of WebFX. Bill has over 25 years of experience in the Internet marketing industry specializing in SEO, UX, information architecture, marketing automation and more. William’s background in scientific computing and education from Shippensburg and MIT provided the foundation for MarketingCloudFX and other key research and development projects at WebFX.
 -

WebFX is a full-service marketing agency with 1,100+ client reviews and a 4.9-star rating on Clutch! Find out how our expert team and revenue-accelerating tech can drive results for you! Learn more
Make estimating web design costs easy
Website design costs can be tricky to nail down. Get an instant estimate for a custom web design with our free website design cost calculator!
Try Our Free Web Design Cost Calculator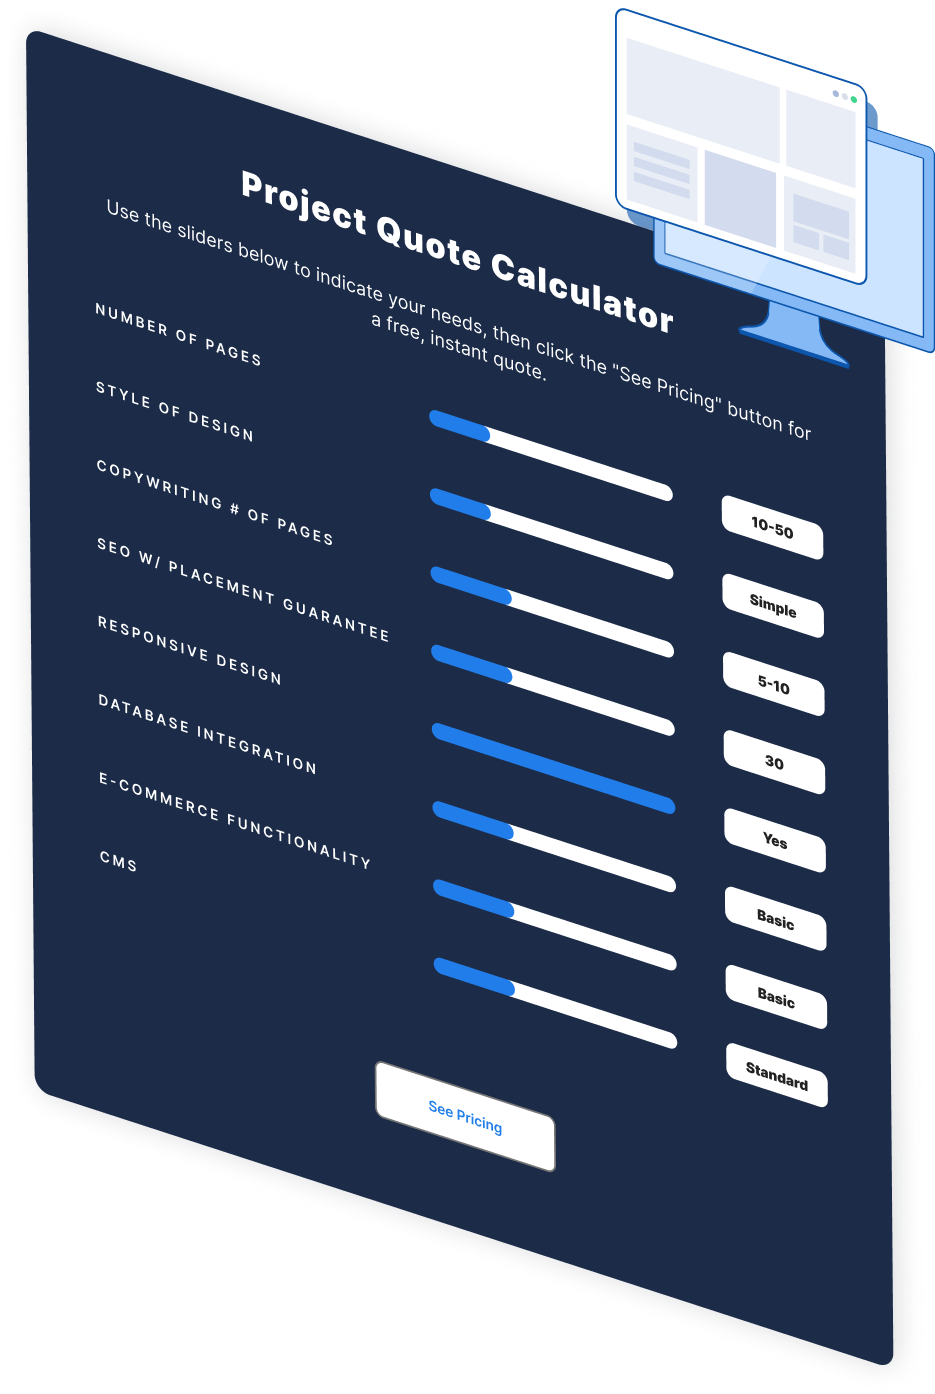
Share this article

Web Design Calculator
Use our free tool to get a free, instant quote in under 60 seconds.
View Web Design CalculatorMake estimating web design costs easy
Website design costs can be tricky to nail down. Get an instant estimate for a custom web design with our free website design cost calculator!
Try Our Free Web Design Cost Calculator