Flash is an excellent technology for dealing with data visualization. It being client-side, it can reduce the amount of work your server has to perform in order to generate graphs and charts. Because of its robust ability in dealing with sleek and fluid animation and complex user interactivity, Flash is an excellent web and (and even desktop) application technology for dealing with graphing data.
In this article, you will find ten excellent Flash components that will help you in building stunningly attractive, complex, and interactive data visuals. These components will help you create an assortment of graphs and charts to aid in presenting otherwise boring and stale numerical data.
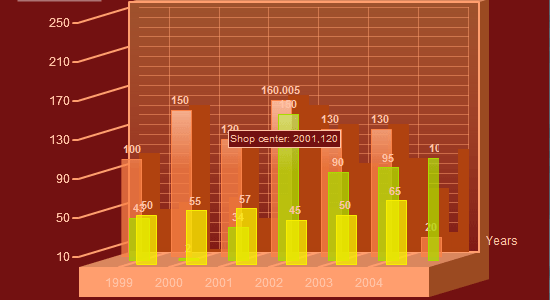
1. Open Flash Chart
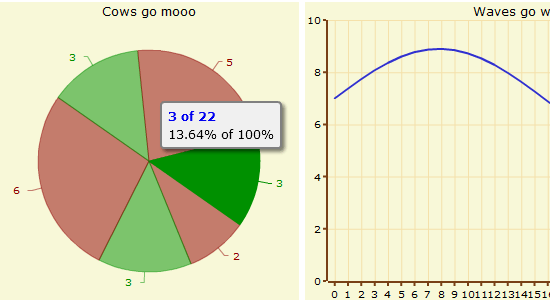 Open Flash Chart is an open source Flash-based graphing and charting solution developed using ActionScript 3 and compiled using Flex. Open Flash Chart’s features include interactivity of your charts with tooltips, the ability to resize your charts client-side, and being able to save your graphs as images. Its native data format is JSON, which makes it a breeze to work with for developers who know C-style language like Perl, Python, PHP, and of course, JavaScript.
There’s some great Open Flash Chart tutorials to get you started right away. Live Demonstrations: Open Flash Chart
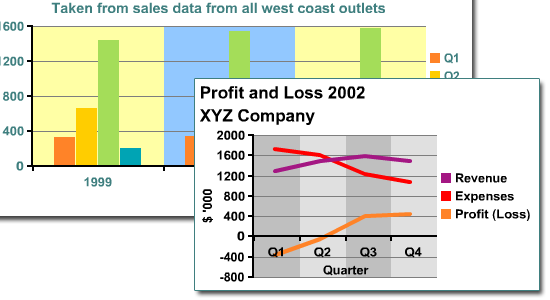
2. XML/SWF Charts
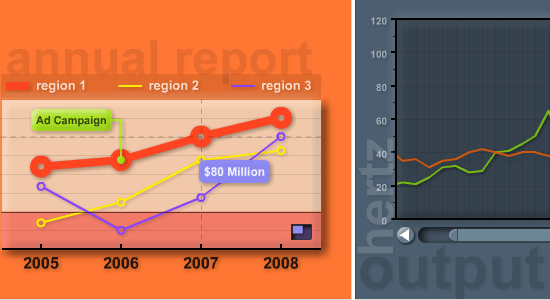 XML/SWF Charts is a powerful Flash component for creating interactive graphs and charts. With XML/SWF, you can use XML to describe the data you’re wishing to plot, making it easy to create dynamically-generated and easily-maintainable Flash charts (i.e. you need only to alter the XML file instead of having to use Adobe Flash application).
Check out this basic tutorial to get you up and running right away with XML/SWF Charts. XML/SWF Charts is free to download and use, and the Free license only has a few features unavailable to you, such no technical support. The Single License and Bulk License is $49 and $59, respectively.
Live Demonstrations: XML/SWF Charts
3. zxChart
 zxChart is a Flash component that allows you to create dynamic graphs and charts. It allows data input in numerous ways including static files (text files, XML) or via scripting (PHP, ASP, Perl, etc.). zxChart costs €35 (roughly $20).
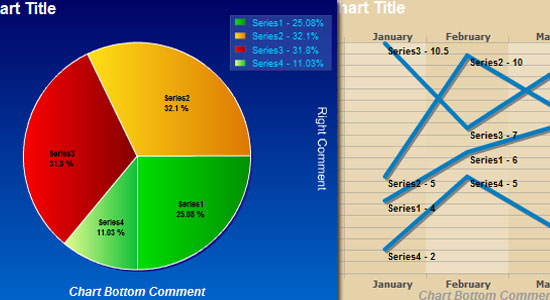
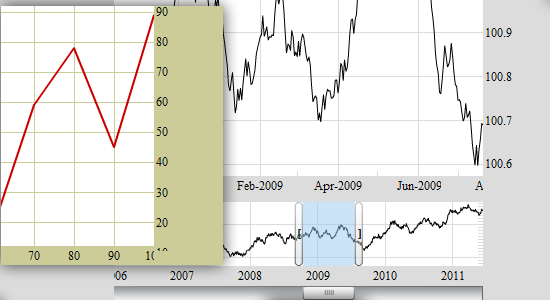
4. amCharts
 amCharts is a set of excellent Flash graphing/charting components for your web-based data visualization needs. amCharts can take in data from static files such as CSV or XML, as well as from dynamically-generated data inputs using popular scripting languages like PHP, .NET, Java, and Ruby on Rails. Live Demonstrations: amCharts
5. Fly Charts
 Fly Charts is a Flash component for graphing data. Fly Charts has an Online Wizard to help you quickly create your Flash charts, making it extremely accessible even to non-developers. Fly Charts has many outstanding features such as the ability to zoom into any section of a chart, the capability to become scrollable if the chart is too big, client-side interaction with JavaScript, and error-handling for missing data.
Fly Charts is available for free for private use but will contain a link to the Fly Charts website. Commercial-use and developer licenses range from $99 to $799. Live Demonstrations: FlyCharts
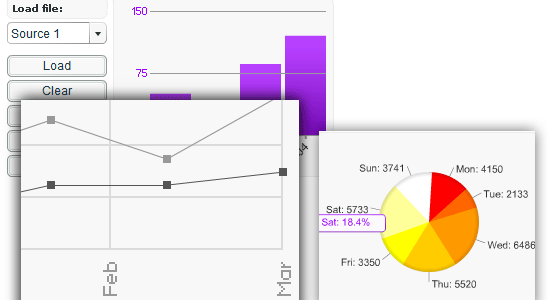
6. AmiChart
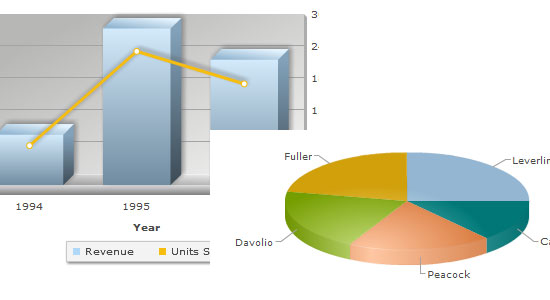
 AmiChart is an easy to use and user-friendly Flash-based graphing component that can create animated column, line, and pie charts. AmiChart is Microsoft Office friendly, offering you the ability to embed graphs and charts into your PowerPoint slides and use data copied from an Excel spreadsheet for your data inputs. You can also use CSV file for data input.
AmiChart has a 15-day free evaluation which gives you unfettered access to all its features. A single-user license costs $39. Live Demonstrations: AmiChart
7. Black Box Chart
 Black Box Chart is a free Flash component for charting data on the web. Black Box Chart offers you an interactive solution for data visualization, clicking on data points of bar graphs outputs the data value. The Black Box Chart editor is a tool that you can use for creating and editing your charts using a graphical user interface (GUI).
Live Demonstrations: Black Box Chart
8. flashCharts
 flashCharts is a set of five attractive, animated, and data-driven Flash components for use in the creation of dynamic, as well as static, charts. flashCharts components are designed specifically for developers or designers, so whatever your background, you’ll be able to use it. It’s lightweight, weighing in at only 12KB, and has an ActionScript API for easily working with your charts and graphs.
The whole set costs $99, but you can buy some components separately starting at roughly $30. Live Demonstration: flashCharts barchart
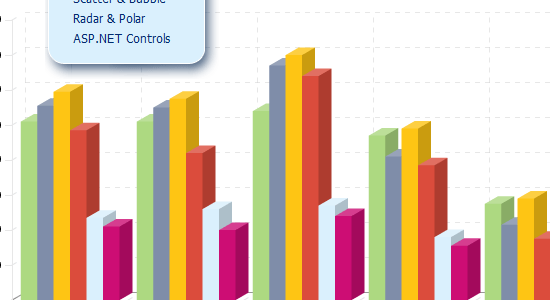
9. FusionCharts
 FusionCharts is an excellent Flash component for creating animated and interactive charts for the web or desktop applications. FusionCharts integrates with a lot of web technologies including PHP, ASP.NET, JSP, RoR and a bunch of other acronyms. With FusionCharts, you have access to over 45 types of 2-dimensional and 3-dimensional charts.
Check out the user showcase to see actual applications of FusionCharts. There are five types of licenses for FusionCharts, and the price ranges from $69 for a user license all the way up to $1,999 for an enterprise license. Live Demonstrations: FusionCharts
10. Origramy
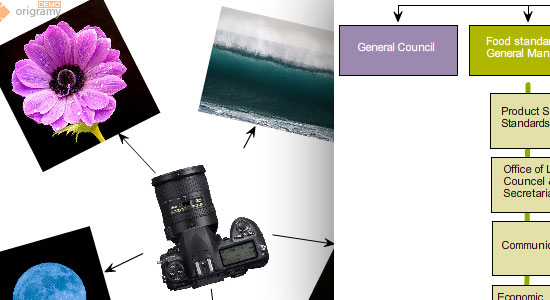 Origramy is a graph editor and viewer Flash component. You can use it to create complex and interactive graphs and charts for presenting data. Origramy is available free for private use but will contain a link to Origramy – commercial licenses start at $99. Live Demonstrations: Origramy
What’s your graphing solution?
Do you deal with data visualization? What do you use and why? Have any experience with the Flash components above?
Share your thoughts and opinions on this topic in the comments!
Related content
-
 President of WebFX. Bill has over 25 years of experience in the Internet marketing industry specializing in SEO, UX, information architecture, marketing automation and more. William’s background in scientific computing and education from Shippensburg and MIT provided the foundation for MarketingCloudFX and other key research and development projects at WebFX.
 -

WebFX is a full-service marketing agency with 1,100+ client reviews and a 4.9-star rating on Clutch! Find out how our expert team and revenue-accelerating tech can drive results for you! Learn more
Make estimating web design costs easy
Website design costs can be tricky to nail down. Get an instant estimate for a custom web design with our free website design cost calculator!
Try Our Free Web Design Cost Calculator
Share this article


Web Design Calculator
Use our free tool to get a free, instant quote in under 60 seconds.
View Web Design CalculatorMake estimating web design costs easy
Website design costs can be tricky to nail down. Get an instant estimate for a custom web design with our free website design cost calculator!
Try Our Free Web Design Cost Calculator