Data visualization is an effective way of tracking progress, gaining insights and representing information in an easy-to-understand way. There are a wide variety of paid visualization tools, but there are also loads of free options available.
You can use data visualization tools to create a story with your data, helping people in your company understand and make data-driven decisions. Find such tools in this list of free options.
The 7 best free data visualization tools online
This guide will serve as a free data visualization tool comparison to help you find the right free tool for your needs.
1. Vizdium
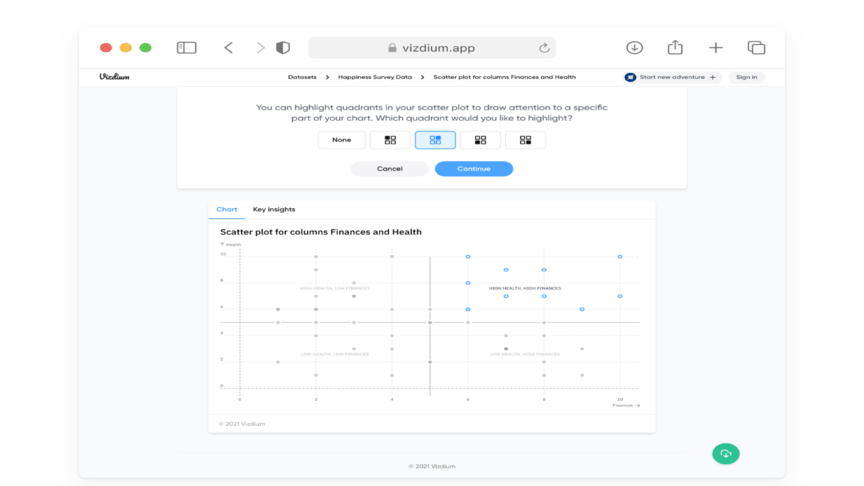
Vizdium is a database visualization tool designed to streamline the analysis of simple data. Created by Venngage, Vizdium is a data analyst that can sift through spreadsheets and tables and extract valuable data in an instant. All you need to do is upload your spreadsheet or document to Vizdium as a CSV file and it will extrapolate and visualize your data however you need.
Vizdium is a tool that can be used for anything from analyzing sales data to mapping out survey results. You can display information as bar graphs and other charts as well as word clouds for finding keywords in comments. This is a completely free tool that can be downloaded for free without needing to sign up. The only con is that it won’t store your data so you will need to input everything before finishing your session.
2. RAWGraphs
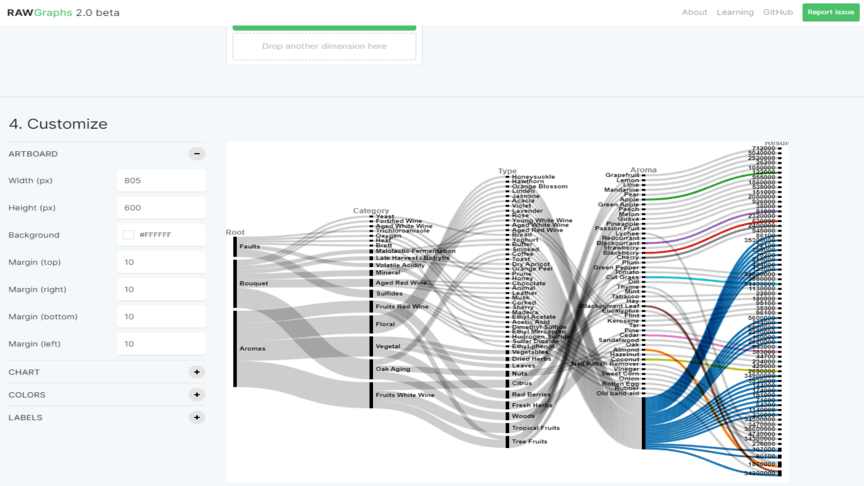
RAWGraphs is an open source tool for data and visualization purposes. Being open source means anybody is able to access the source code and contribute to it. As a result, there are 30 different types of data visualization tools available on RAWGraphs with the community still working on it.
It works in the same way Vizdium does, where a data set is uploaded and visuals are created based on that. Vizdium offers suggestions for the best chart type to use, RAWGraphs lets you choose whichever one you want to use. Then you must choose the data points you want featured in your chart.
RAWGraphs is best suited for those who have more experience with advanced data visualization. There is a bit of a learning curve for newcomers, but this tool’s flexibility and freedom make it one of the best free data visualization tools.
3. Datawrapper
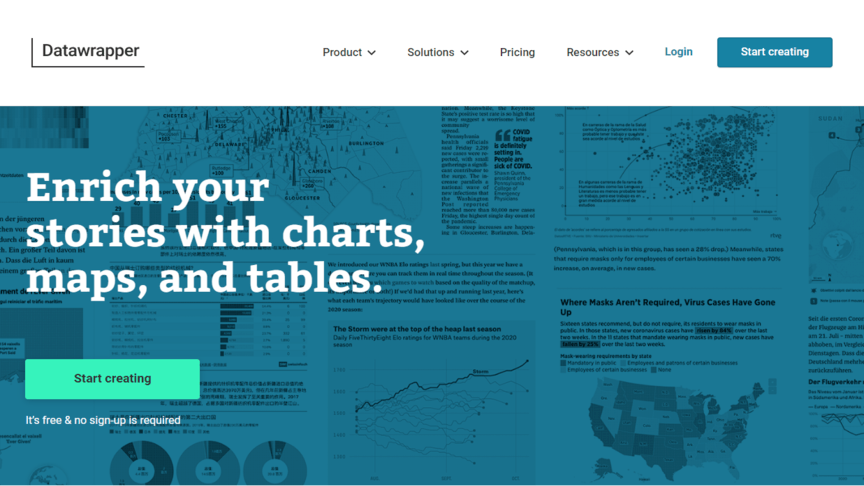
Datawrapper is a data visualization tool designed to extract data from news stories. The charts created by Datawrapper can be embedded on news pages and websites. Data can be represented through one of 19 different interactive styles of charts, three types of interactive and responsive map types or organized and presented in tables. Track keywords and article popularity by location and even more with this useful tool.
There is a free trial that lets you create, publish and export your data visualizations which is an excellent option for small news sites and blogs. The data visualization tool includes accessibility options like a built-in color blindness checker. The drawbacks of the free version are the limited scope of tools and the paid options can add up quickly.
4. Flourish
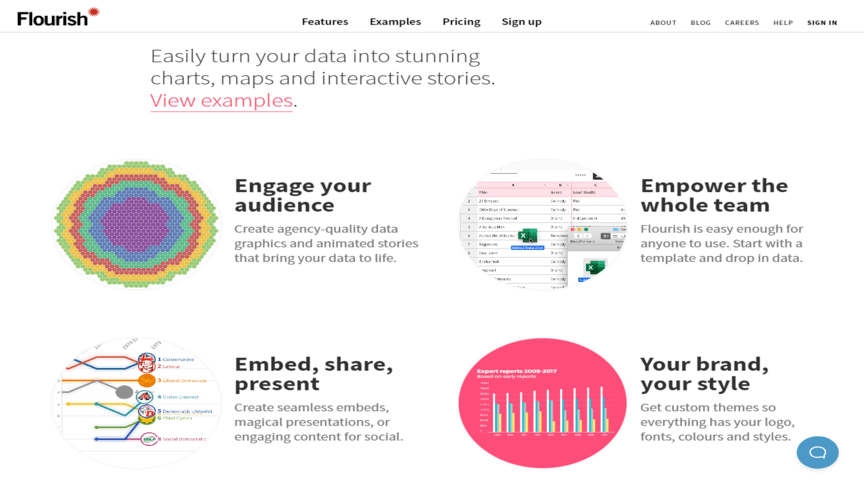
Flourish is a data visualization tool made for the design process rather than focusing on data analysis and exploration. Flourish can produce infographic-worthy graphs out of any data. When starting a new visualization project or story, Flourish will present you with a list of templates where you can plan your dashboards and the type of data charts you wish to include. These templates can be customized and added to as you work.
This tool is used to organize already analyzed data and create charts and visualizations that look incredible for presentations and sharing with teams. The vast amount of customization and types of data visualization is what makes it stand out from others on this list.
5. Databox
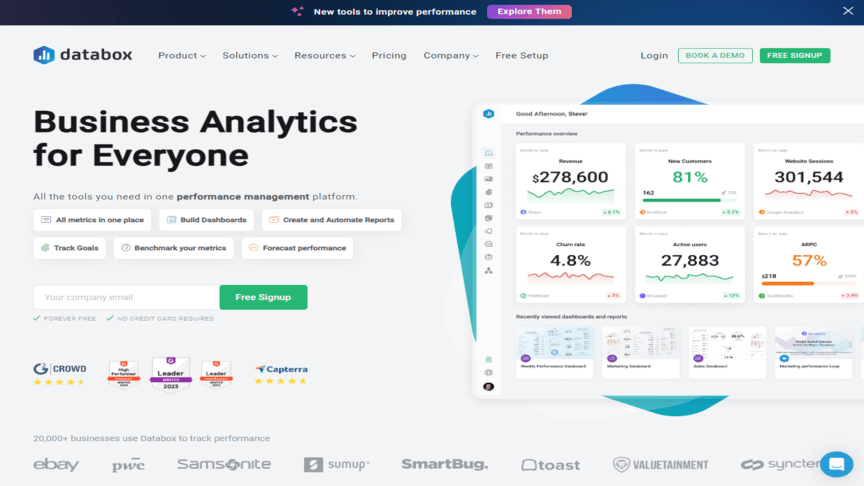
Databox is a business analytics platform designed to make keeping track of data easy for companies. With more than 70 data integration options, this versatile tool can visualize data from almost any source including Google Sheets and social media sites.
Once you’ve signed up there is a short tutorial video that runs you through the basics before you can start using the tool. The free version of Databox offers plenty of features, but to access all the features you will need to pay. The pricing plans are broken down by the size of your company and your needs.
6. Visualize Free
Visualize Free is a cloud-hosted tool and a zero-client app. It offers a free-to-use comprehensive platform used for reporting, data visualization and dashboards. All you need to do is upload your spreadsheet and use the drag-and-drop features to create your ideal dashboard for easy data management and analysis.
Because Visualize Free utilizes a single in-cloud server usage and privileges must be limited, but your access can be upgraded with paid upgrades for a fraction of the cost compared to the major competitors.
7. Klipfolio
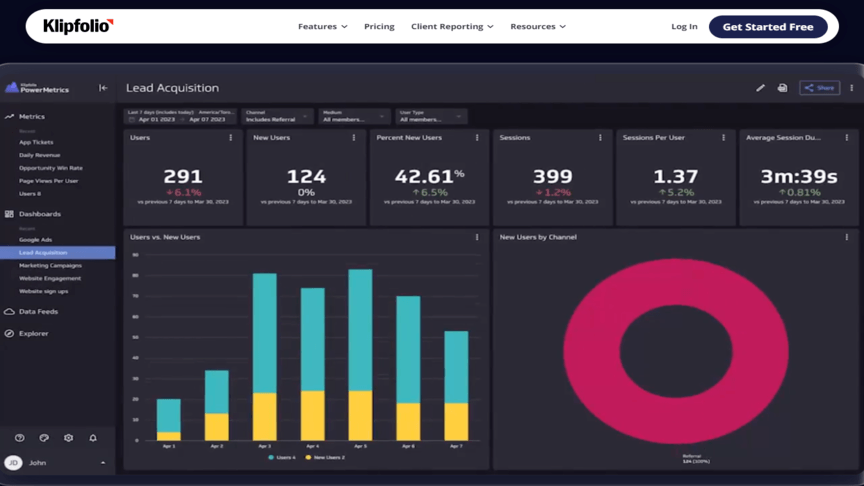
Klipfolio is an easy-to-use data visualization tool that curates to any metric you need. Klipfolio has a powerful data modeler that lets you utilize data in everyday monitoring and and data analysis. You can edit, import and analyze data however you want to help you find relevant insights that matter to you.
Klipfolio offers a free plan with hundreds of integrations for data visualization just the way you want. Businesses that require customized dashboards need to give this reliable and versatile tool a try.
Found the right data visualization tool for your business?
When it comes to data visualization you need a tool that will work for you, meet your needs and is easy to understand. This list explores the finest free data visualization tools for you to try out. Present data to your teams and clients and use these visualization tools to find new insights.
At WebFX, we appreciate how important it is to have the right data and the right tools to present it properly. Our team of over 500 experts will help you create data visualizations that get your point across clearly and find the insights hidden within.
If you want to engage your leads with data visualizations in a meaningful way, contact us or call us today at 888-601-5359 to speak with one of our strategists.
-
 President of WebFX. Bill has over 25 years of experience in the Internet marketing industry specializing in SEO, UX, information architecture, marketing automation and more. William’s background in scientific computing and education from Shippensburg and MIT provided the foundation for MarketingCloudFX and other key research and development projects at WebFX.
 -

WebFX is a full-service marketing agency with 1,100+ client reviews and a 4.9-star rating on Clutch! Find out how our expert team and revenue-accelerating tech can drive results for you! Learn more
Make estimating web design costs easy
Website design costs can be tricky to nail down. Get an instant estimate for a custom web design with our free website design cost calculator!
Try Our Free Web Design Cost Calculator
Share this article


Web Design Calculator
Use our free tool to get a free, instant quote in under 60 seconds.
View Web Design CalculatorMake estimating web design costs easy
Website design costs can be tricky to nail down. Get an instant estimate for a custom web design with our free website design cost calculator!
Try Our Free Web Design Cost Calculator