If you’re a regular reader of WebFX, you’ve probably noticed we’ve put out a lot of content this year. That’s no accident. Like most digital marketing agencies, we plan our annual goals well in advance so we have time to accomplish (and exceed) them.
Before 2016, we published infographics occasionally. Someone would think of a topic or something would happen in the news, and we’d strike while the iron was hot. But we had a burning question that we couldn’t answer before this year.
What would happen if we scheduled every infographic we wanted to publish in a year? So that’s what we did — and we learned a lot. For context, let’s establish what we wanted from our infographic plan in the first place.
What we wanted
Our goal was to build links.
Traffic, time on page, and social shares were all secondary. Specifically, our goals were:
- A quantity of links from reputable sources
- An average cost per link below a certain threshold
Once we figured out how we’d measure that success, and we got to work. Our first infographic went out on 1/11/2016. Our last one will go out on 12/19/2016. This is what our data for that time looks like…
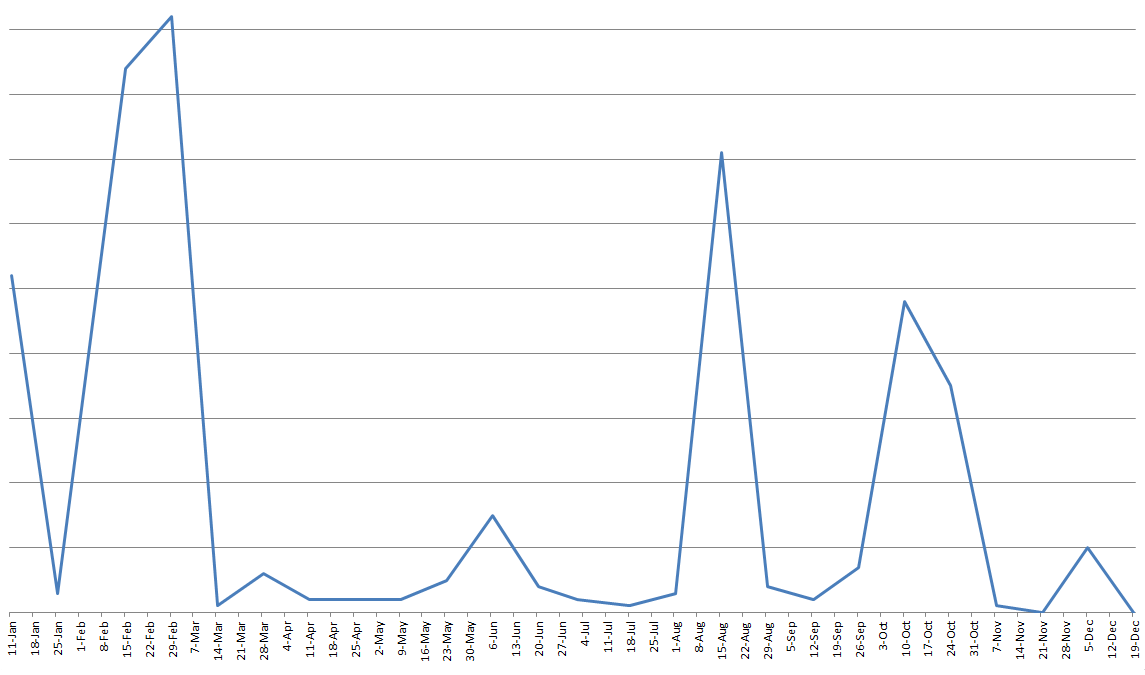
… and this is what we learned in between.
1. People love infographics
Even without a Y-axis label (it’s top secret), you can see that we had our ups and downs — literally. But the point of the graph is pretty clear: People really like infographics. Like, a lot.
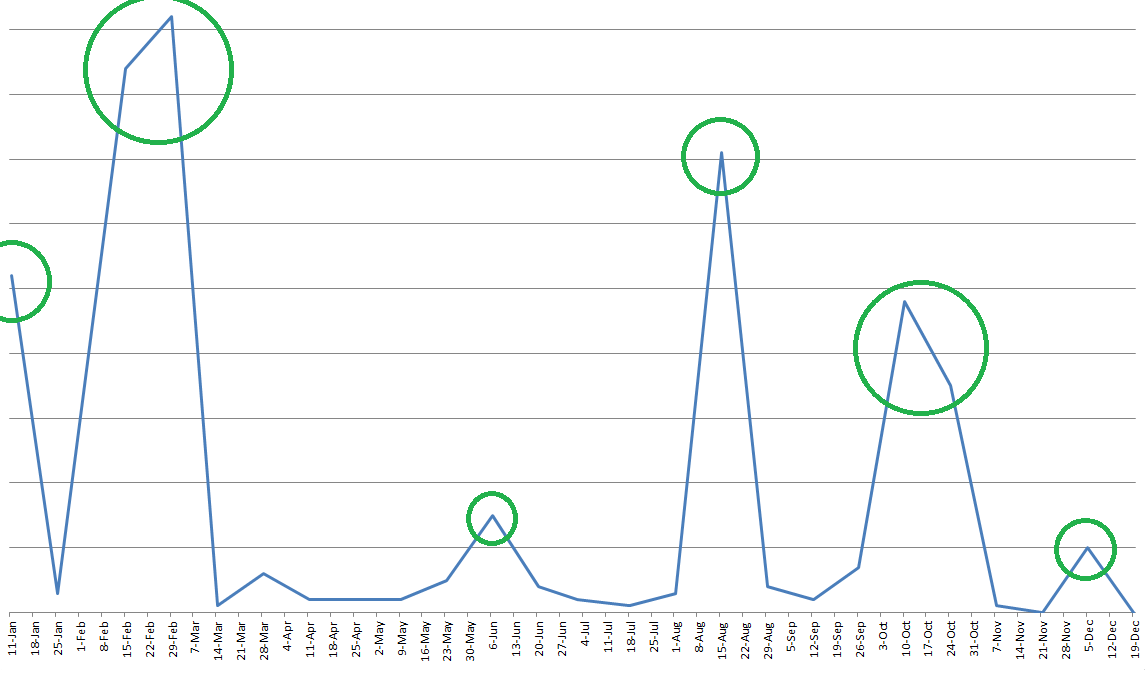
Highlighted: Sweet, sweet victory.
Our ups were huge ups.
And if we charted our social media shares and mentions at these times, they’d make our link totals look like a flatline. Right out the gate in 2016, we were doing some great things. We found that infographics that combined data and helpful information worked the best.
Then, on March 14 (two months before Harambe died), our results slowed down. We recovered pretty well on June 6, but we hit another big roadblock until August. Then we rebounded, dropped, and rebounded again.
In general, we found that infographics that combined data and helpful information worked the best. After we figured that out, we used that idea to guide our future infographics. But as you can see, not all infographics will work.
2. Some infographics are loved more than others
We had some exceptional infographics in 2016. People loved some of them, and they hated others. That’s because every infographic is different — and that includes how much people like them. 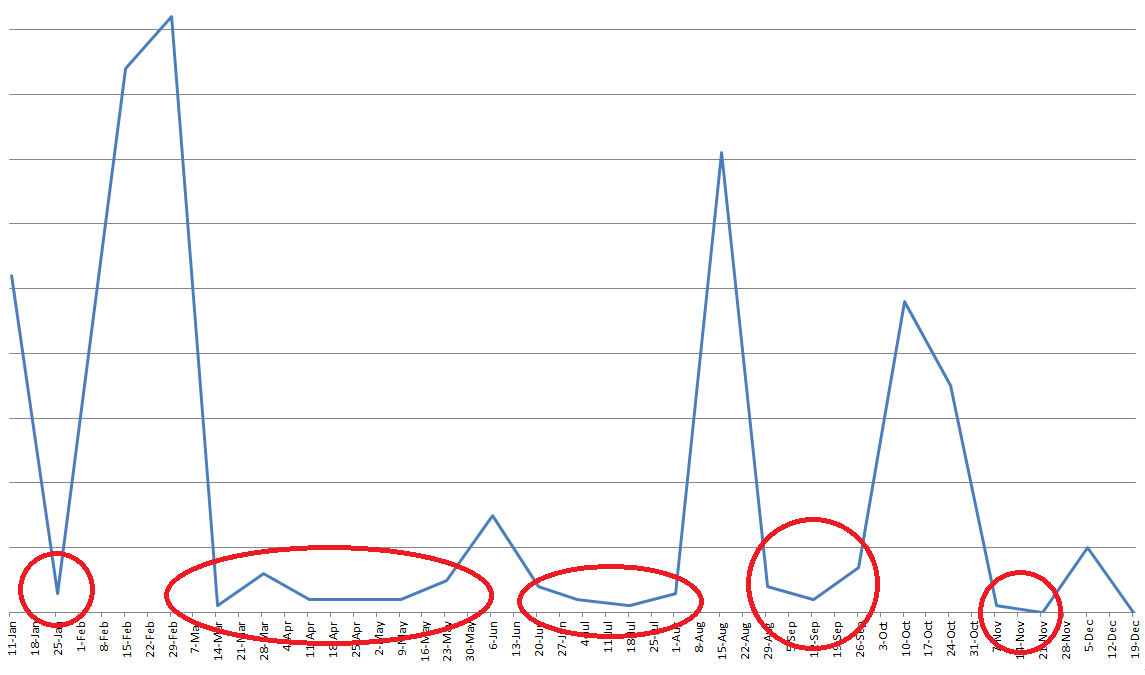
Highlighted: Sadness.
These examples didn’t perform as well for a number of reasons.
Some of them had data, but they didn’t provide helpful information to complement it. Other infographics had helpful advice, but they didn’t have the data to back up that advice. Still others were a little too far off the mark for the marketing industry, which is why they didn’t succeed.
Finally, we can’t figure out why at least three of these infographics didn’t work. Those outliers are the strangest infographics on our site because, as far as we could predict, they should have worked. Which brings me to my next point…
3. Predicting success is hard
When you plan to produce and publish an infographic every two weeks, your gut feeling is a good place to start. But we knew that wouldn’t keep us above water forever. We needed some definite successes to tell us what we were doing right and what we needed to stop.
Basically, we A/B tested a year’s worth of infographics. That meant a lot of turbulence, which you can see in the last section’s graphs. Of our 12+ failures, we were sure that all of them were going to succeed.
Otherwise, why would we pursue them in the first place? With that in mind, it’s all too easy to think you know the magic mixture of infographic ingredients that lead to a guaranteed success. But putting that into practice is a challenge.
Honestly, we’re still not 100% sure, and we’ve been tracking this every day for a year. But we’ve tested a few repeat successes, and those have helped us achieve that end-of-year mountain range you see in our data spread. Overall, we didn’t win with every infographic.
But when we won, we won big.
4. The market is saturated
This is an undeniable fact about infographics today. Millions of people want infographics, but there are so many bad ones (sorry) that it’s hard for the good ones (you’re welcome) to stand out. If you want proof, just search “infographic” on Twitter, click “Latest,” wait 10 seconds, and see how many new tweets there are.
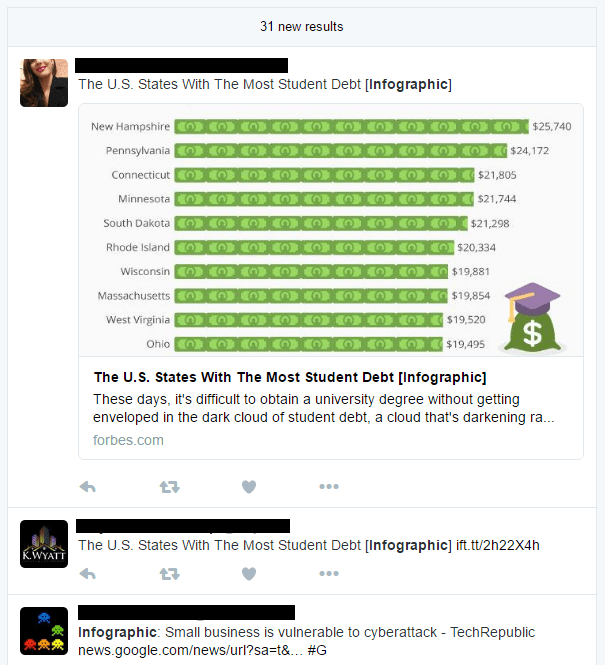
You should see it when someone discovers Fiverr.
I’ve personally done this about 100 times this year (coming up with ideas is hard), and people push infographics like they’re going out of style.
And that’s because they are. But this isn’t an end-of-days kind of thing. We still have several years until infographics really go out of style, and there will probably always be a market for digital visualization in the world.
The problem is that there are more advanced and interactive ways to display data. Infographics are static images, and as UX merges with VR over the next few years, infographics will become less exciting to Internet users. More than likely, they’ll be replaced by interactives or more emotion-based storytelling that uses data as a supplement.
But in the meantime, it seems like everyone out there wants to get their slice of the infographic link building pie. That may be a terrible metaphor, but the point of it is still true — everyone has an infographic they want you to see.
5. Quality is essential for every infographic
The best and worst part about infographics is that you usually know you whether you have an awesome idea within 10 minutes of promoting it. Whether that’s outreach, social media, or sharing it with the person next to you, you can tell when you’ve nailed an idea. When you do, your infographic pretty much sells itself.
The really good ones even inspire site owners to click all the way back to your original publication to give you proper credit. When you don’t, your infographic just kind of lays there like a bored golden retriever. But no matter the outcome, you should never compromise on quality.
We still earned some links for infographics that didn’t wind up working like we wanted. Those links are consolation prizes for misreading the content market at the time, but they’re just as important to our link building success the ones that point to our more successful infographics. So even if you aren’t sure whether a topic will be a hit, design it like it will.
Because if you can’t be proud of it, why make it in the first place?
6. Outreach works, but some people hate it
A lot of the fun in infographics comes from outreach. You need to tell people online that you made something — they can’t link to you otherwise. That’s why we added an outreach strategy on top of our infographic strategy.
We needed a way to get in touch with influencers. (Twitter works too, but email is king.) Sometimes it works… 
Score.
…and sometimes it doesn’t. 
Fair enough.
Just like our infographics as a whole, we’ve experienced a lot more failure than success in our outreach.
But a less-than-50% success rate doesn’t mean you’re doing something wrong. After all, most conversion rates hover between 2-5%, and we manage to do better than that with good content and tracking outreach results. Do you get some angry people every once in a while?
Sure. You’re basically knocking on their digital front door and asking if they have a moment to hear about your infographic. But most people will politely decline, energetically accept, or try to “backreach” you with some content of their own.
Regardless, you’ve connected with someone in your industry. It may not be the start of a long-lasting business relationship, but you’re still getting our name out there. In the meantime, you get some nice links.
7. Others will succeed from your work (more than you)
Last August, I published an infographic about how advertising persuades people to buy. A few days after I pushed it live, HubSpot picked it up. I was ecstatic — a DA91 website linked to one of the first infographics I handled.
How cool is that? (Plus it happened on my birthday.) But then I noticed something weird. 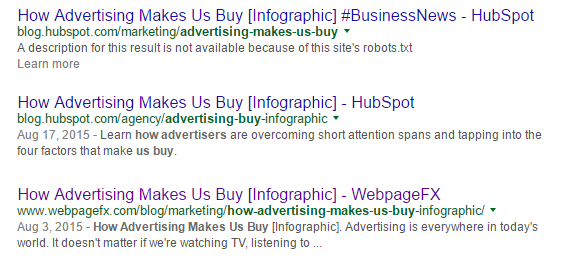
Ouch.
HubSpot outranked us for our own original content on our own keyword — twice.
This was a surprise at first, but as any SEO can tell you, being first to publish doesn’t guarantee that you’ll be first in organic. It was just my first personal experience with being beaten at my own game online. So going into 2016, we knew this would be an obstacle for WebFX.
HubSpot is a huge name in marketing, they have a great blogging team, and they’re just one marketing blog online. In fact, I don’t think we’ve ever once outreached to them — but their team has an excellent eye for quality content. Our solution was to outreach as quickly as possible and in a very particular order (plus a few other factors I can’t give away).
We applied that strategy to our first publication of the year. And, well, it worked. 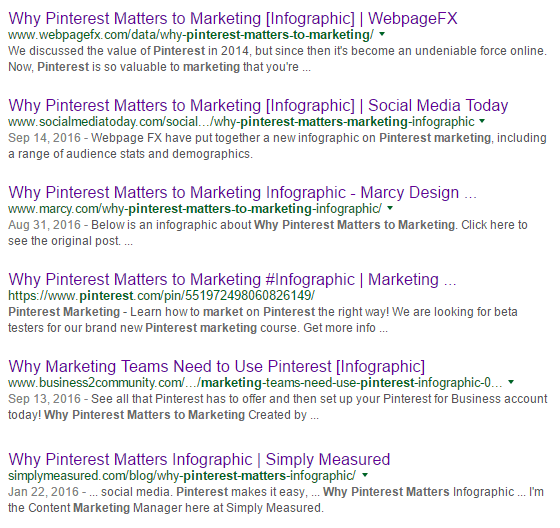
That’s the stuff.
We outreached with the goal of increasing the odds that we’d acquire more links than anyone who posted our content.
Don’t get me wrong — we’re grateful people post our infographics. And in the end, it helps them as much as it helps us. But we have to fight to stay at the top, just like any other website.
If we hadn’t figured out the formula we use for outreach, the beginning of our year would’ve been much rougher. We might not even be on the first page of search results for our own content if we hadn’t learned.
8. Failure is inevitable
Failure is simultaneously the best and worst part of our year. When you publish an infographic every other Monday, you strive to make every single product a winner. But as any Six Sigma black belt can tell you, 100% success is a pipe dream — maybe even the pipiest.
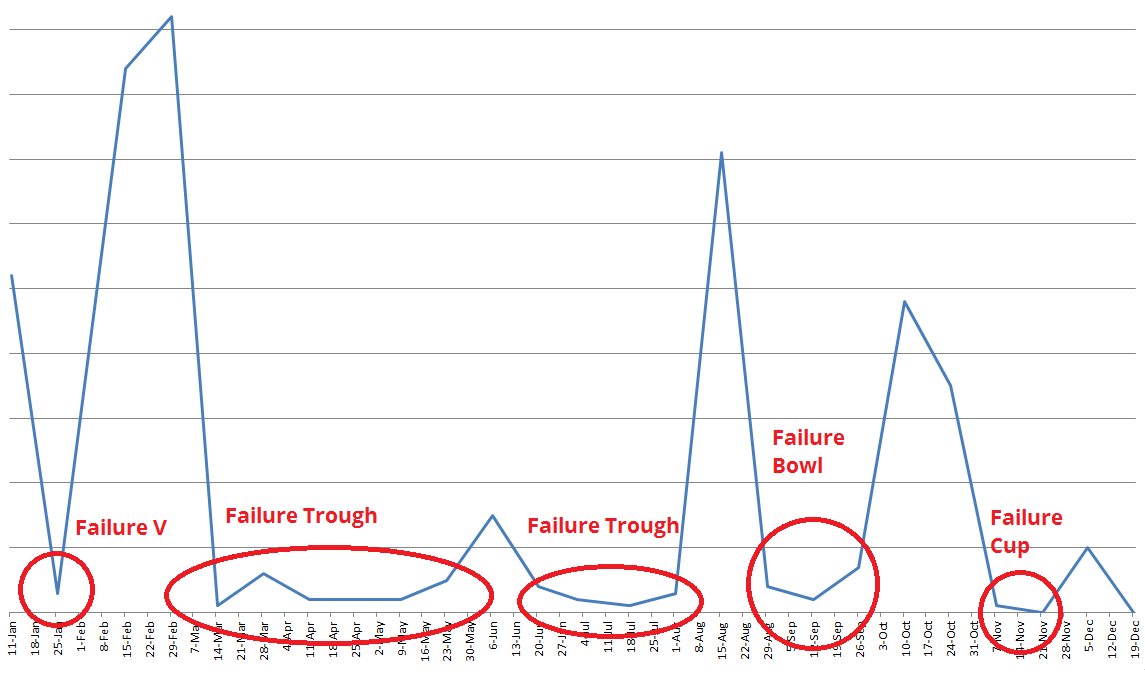
Failure Cup is a little lopsided.
If you want to try what we did, just know ahead of time that you’re going to fail a lot. But that’s not a bad thing because those are your opportunities to do better. Those opportunities are crucial to succeeding with infographics.
If you don’t have them, then you don’t have the chance to grow. That means you’re either stagnating or regressing, and both of those are unacceptable in an industry that literally changes every day.
9. The next 5 years won’t be all about infographics
This isn’t so much something I’ve learned as it is something I’m noticing now. But in the last year spent with infographics, it seems unlikely that they’ll continue being the link building go-tos that everyone knows and loves. They’ll still work — probably for decades.
But with the increasing emphasis on UX, the introduction of VR browsing, and the general pace of technology, infographics are getting replaced with some pretty impressive stuff. That makes sense, in a weird way. Companies publish infographics (and other content) because everyone can be their own publishing house once they have a website.
Now that everyone distributes content, it’s amping up the stakes for everyone to outdo their competitors. That’s leading to some crazy-cool advancements, especially with storytelling, interactivity, and data visualization. In fact, don’t be surprised if you see companies publishing their own video games over the next couple years as a way to tell brand stories. Before you laugh at that, consider this: In 2014, someone started a Kickstarter campaign asking for $10 to make potato salad.
They got more than $55,000 because they attached a story to their cause. So storytelling works. What better way to tell your brand’s story than to make your customer the hero of your own video game?
But the future isn’t set in stone. VR, video games, apps, and other not-yet-invented content formats will take the marketing world by storm over the next few years. So the question isn’t whether it’ll happen — but who will lead the charge?
Does your business use infographics?
Have you published infographics for your company?
What results have you seen? Let me know in the comments!
-
 Trevin serves as the VP of Marketing at WebFX. He has worked on over 450 marketing campaigns and has been building websites for over 25 years. His work has been featured by Search Engine Land, USA Today, Fast Company and Inc.
 -

WebFX is a full-service marketing agency with 1,100+ client reviews and a 4.9-star rating on Clutch! Find out how our expert team and revenue-accelerating tech can drive results for you! Learn more
Try our free Marketing Calculator
Craft a tailored online marketing strategy! Utilize our free Internet marketing calculator for a custom plan based on your location, reach, timeframe, and budget.
Plan Your Marketing Budget
Table of Contents
- What We Wanted
- 1. People Love Infographics
- 2. Some Infographics Are Loved More Than Others
- 3. Predicting Success is Hard
- 4. the Market is Saturated
- 5. Quality is Essential for Every Infographic
- 6. Outreach Works, but Some People Hate It
- 7. Others Will Succeed from Your Work (more Than You)
- 8. Failure is Inevitable
- 9. the Next 5 Years Won’t Be All About Infographics
- Does Your Business Use Infographics?
Share this article
Maximize Your Marketing ROI
Claim your free eBook packed with proven strategies to boost your marketing efforts.
Get the GuideTry our free Marketing Calculator
Craft a tailored online marketing strategy! Utilize our free Internet marketing calculator for a custom plan based on your location, reach, timeframe, and budget.
Plan Your Marketing Budget