While it’s not often thought about as such, pattern recognition is a huge part of marketing and business acumen as a whole. Identifying patterns in consumer behavior, client interaction, or sales is vital — especially if you use multiple channel sales. Patterns play a huge role in Internet marketing, too.
A huge part of Google’s algorithm is based on pattern recognition. Fortunately for business owners, using patterns doesn’t require a PHD or a bunch of fancy programs. You can use tools like Google Analytics, Microsoft Excel, and old-fashioned pen and paper to help identify and capitalize on yearly sales patterns for your business.
What’s in a Pattern?
 Most businesses have their busy and slow seasons.
While there are obvious examples of seasonality in the outdoors and holiday verticals, even non-seasonal businesses are likely to have ups and downs during specific periods each year. This can be due to laws, fiscal year-end timing, summer lulls, etc. While it’s easy to dread months that are typically down for your business, identifying them and planning around them opens up a world of opportunity.
Most websites have some sort of web analytics software installed that makes gathering your data a breeze. Using those numbers, we’re able to quantify yearly sales trends for your business and make actionable recommendations designed to grow revenue and leads each month. So how do you figure out what a typical year looks like?
Here are a few ways I do this using free tools.
Identifying and Charting A Yearly Sales Pattern
Google Trends
If you don’t have access to Google Analytics or aren’t currently using any analytics tracking on your website, Google Trends is a good tool to ballpark your yearly sales patterns. Let’s say I own a small business selling kayaks and canoes. I can plug in a few product keywords into Google Trends and see the amount of searches performed in Google for each of those keywords over the last few years.
This is a quick way to see the overall interest trend for an item in recent years. It’s worth noting that Google Trends isn’t going to be nearly as accurate for your particular business as something like Google Analytics or your website tracking software of choice. If you are low on time or are just getting started on the web, Trends is perfect for this!
Google Analytics
While Google Trends is good for industry-wide estimations, nothing will be more accurate for your company than looking at your website data through Google Analytics.
To get started, we’ll want to set a specific time frame in Google Analytics. Set the date range for as wide as possible. Five years of data is better than three for this project.
Once you have the date range set in Analytics, we need to figure out exactly what we want to measure. If you are an ecommerce store, revenue would be best since we’re trying to calculate sales patterns. If you don’t sell products through an online store, you can measure the number of leads instead.
I also like to look at a secondary metric to get a broader view of product demand during each month. For that, I like to pull in some overall traffic numbers that we can compare alongside revenue or leads. If you are an ecommerce store, head over to the Ecommerce section in Analytics and change the main graph to show revenue by month.
Export that into Excel (in xlsx or CSV format):  Repeat the process for our secondary metric (overall sessions in this case) and you’ll end up with two different Excel files. Once you open them up in Excel you’ll see something like this:
 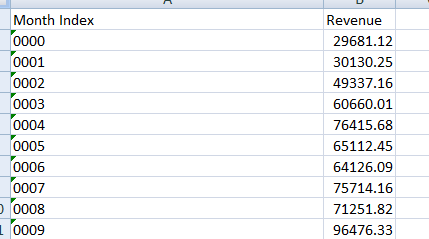 One column will give you the month and the other the revenue/visits. You’ll have to go through and update the exact month names to correspond with your charts.
Do that, condense the two reports, and you’ll end up with a nice output of raw data: 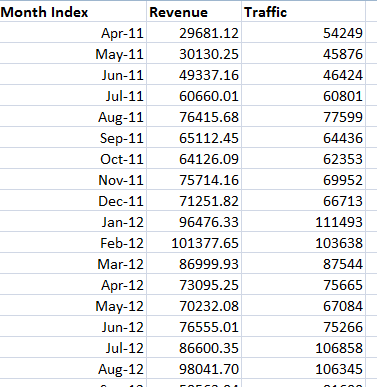 Our data is in order, but we want to make it easier to understand spot particular yearly sales trends. I take the raw data and reorganize it by making each month of the year a column in Excel and each new year its own row. This makes it very easy to compare year-over-year numbers and trends.
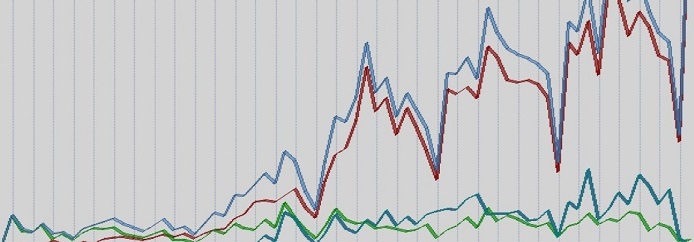
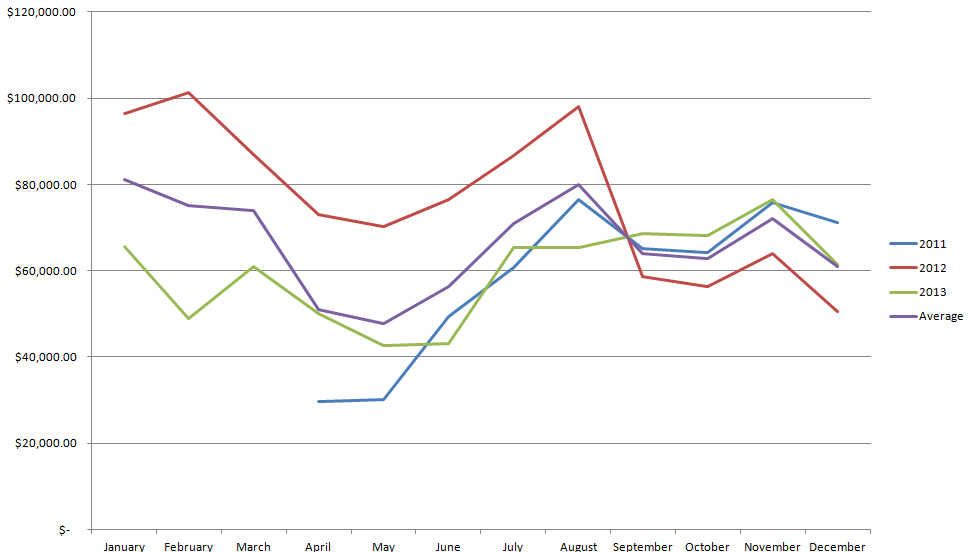
Averaging out the numbers for each month gives you a easy-to-understand overview of how your past years have forecasted based on hard numbers. In this example, April, May and June have consistently had the lowest revenue and traffic, while August, January, February and March are peak demand months. 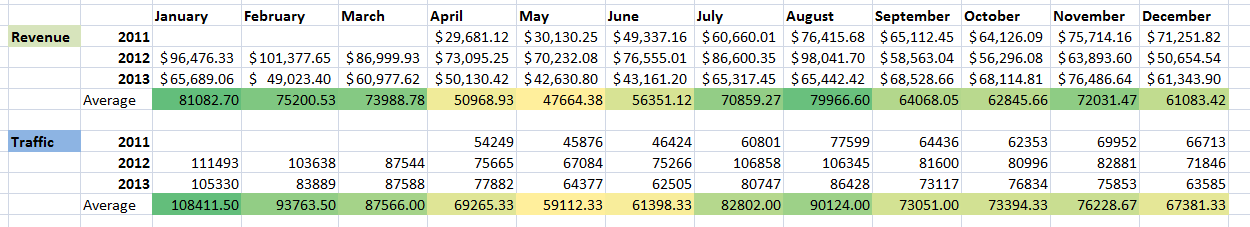 You can use Excel to create some charts that make this even easier to understand.
 In terms of forecasting, one of my favorite tricks is to calculate the percentage of each month’s sales for the year. If 10% of your sales occur in November every year, that gives you a clear-cut plan when setting monthly goals for your business. Let’s say your yearly sales goal is $500,000. You know you need to hit at least 10% of $500,000 in November to reach your goal.
How to Take Action on Your Sales Patterns
Now that we’ve identified a yearly sales pattern and used it to forecast upcoming years and set some goals, here are some other ways to use this data to improve your marketing efforts. As with a lot of marketing, capitalizing on your yearly sales trends comes down to supply and demand. You know there will be certain months that have less demand each year, and certain months with higher demand.
Your exact strategies may differ depending on product and industry, but here are some general marketing initiatives to help you take advantage of this knowledge.
During The Highest Priority Months
If your business’s industry is very seasonal, or even anchored around a few specific days, take steps to make sure your website is ready to handle the incoming surge of traffic. If Black Friday accounts for 5% of your entire yearly revenue, it’s worth upgrading your web hosting and making sure there are no issues. Peak season can sneak up on you.
Make sure your technology is ready to rock.  Once your website is ready to go, use your peak time to be the most aggressive in email marketing and PPC spend. Your peak months are when potential customers are in purchasing mode.
Sending an extra email or two than they are used to won’t annoy them. It will keep you top of mind and keep customers coming back to your site. Plan highly targeted and well-structured email campaigns for your busy season every year. During the holiday shopping season, it’s not uncommon for large ecommerce sites to make tens of thousands from a single email with a strong call to action.
Likewise, as search volume starts to pick up, make sure you are running a finely-tuned PPC campaign. Increased demand means increased competition, and you’ll likely have to pay more for each click. Increasing your ad spend during prime buying time is going to be more effective at driving new sales than increasing PPC spend during a slower month.
Your product or service might not change throughout the year, but the mindset and need for your customer base is always changing. A ski resort is going to have a much higher conversion rate in the late fall or early winter when people are in the “skiing mode,” versus pushing hard in the middle of the summer. A discounted rate would help…
but you can’t easily manufacture demand through a discount alone. Be ready to use both paid and organic channels to cash in during crucial months for your business.
During The Lowest Forecasted Months
Slower months don’t mean you get to spend your time lounging around on a tropical beach. There’s still money to be made and marketing strategies to deploy.
 While peak sales months are the best time to make sure your website is up to modern standards, slower months are a better time to look at your overall website design. Many people interested in doing a website redesign fail to think about timing. You want to launch a new design and work out any growing pains in your less crucial months.
Redesigns can take several months, though, so if you get started during a slow month, you might end up with a launch date in the middle of your busiest time. Be sure to plan ahead. One thing that’s worked well for me in the past is push up the purchasing funnel during off-season times. People might not be ready to purchase a ski resort pass in June, but maybe they’ll sign up for an email newsletter, like the resort on Facebook, or download an informational guide.
These microconversions can pay off in a big way, come peak conversion time. You still want to focus on revenue during slower months, but keep the bigger picture in mind and pay careful attention to the top and middle of your funnel. You can consider running off-season specials or lowering the prices during your tougher months as well.
Savvy customers know the best time to buy a winter coat is in the summer when demand is low. These price conscious consumers are likely to bite on special spring discounts that create a sense of urgency during slower months.
The Importance of Forecasting
Every business is going to go through ups and downs. Some will last a lot longer than a calendar year.
Revenue run rate allows you to forecast your performance and growth in the future. Tracking hard numbers each month, whether you are on a downward spiral or an upswing, is crucial. This data helps you learn more about your sales forecast, which plays a huge role in guiding your marketing decisions.
These steps, a few simple reports from Google Analytics, and basic economics can form the solid foundation of your data-driven marketing plan in 2015! Image credit: David Orban (CC BY 2.0, modified from original), ®Tuncay (CC)
-
 Trevin serves as the VP of Marketing at WebFX. He has worked on over 450 marketing campaigns and has been building websites for over 25 years. His work has been featured by Search Engine Land, USA Today, Fast Company and Inc.
 -

WebFX is a full-service marketing agency with 1,100+ client reviews and a 4.9-star rating on Clutch! Find out how our expert team and revenue-accelerating tech can drive results for you! Learn more
Try our free Marketing Calculator
Craft a tailored online marketing strategy! Utilize our free Internet marketing calculator for a custom plan based on your location, reach, timeframe, and budget.
Plan Your Marketing Budget
Share this article
Maximize Your Marketing ROI
Claim your free eBook packed with proven strategies to boost your marketing efforts.
Get the GuideTry our free Marketing Calculator
Craft a tailored online marketing strategy! Utilize our free Internet marketing calculator for a custom plan based on your location, reach, timeframe, and budget.
Plan Your Marketing Budget