Perhaps the most important percentage to any business is its conversion rate. Conversion rate refers to the percentage of customers that purchase something on any given site, which directly correlates to the amount of profit a business makes. Throughout the years, marketing styles have changed, along with the platforms that they use to advertise.
For example, newspaper advertising eventually changed to television marketing. Today, a time when smartphones are in the hands of nearly every adult (and most teens), advertising platforms have morphed to accommodate mobile users as well. Businesses are now feeling pressure to optimize their sites to appease to both desktop and mobile users to maximize conversions for their businesses.
But is one better than the other? Should you optimize for desktop over mobile, or vise versa? Our data answers your question!
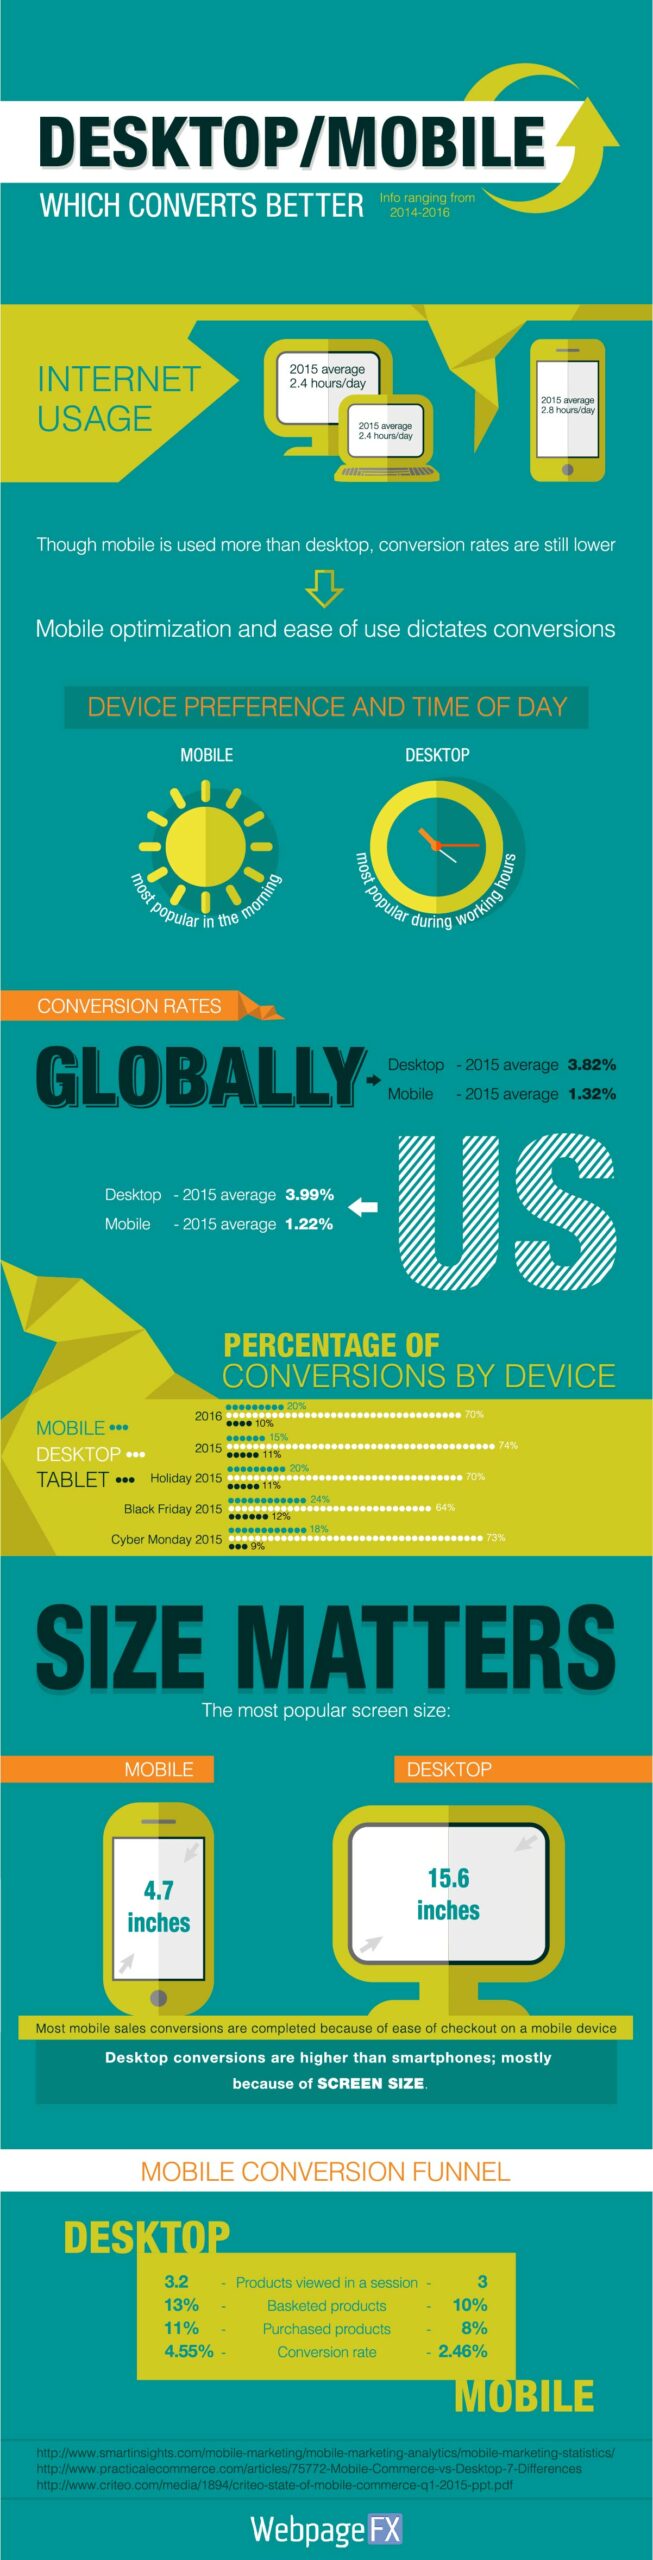
 When looking at which device converts better, it is important to first take a look at how much time is spent on each device. The average time spent on a desktop computer or laptop was 2.4 hours a day in 2015. Winning by a mere 24 minutes, the average time spent on a smartphone in a day was 2.8 hours. Though consumers use mobile more than desktops each day, conversion rates are still lower for mobile devices. This makes it obvious that optimization and ease of use is directly related to conversion rate.
There are many reasons that a computer screen makes it easier to purchase items, including the size of the screen and controlling clicks with a physical mouse rather than your finger. Does that time and user interface impact conversions? And if so, how much?
What do the conversion rates look like for each device?
Globally, desktops convert at around 3.82% and mobile devices convert at just 1.32%. In the United States, the numbers aren’t much different: desktops convert at 3.99% while mobile devices convert at 1.22%. Looking at holiday conversion rates per device tells us even more about the difference in conversion across devices.
For example, during the 2015 holiday season, 70% of the total conversions were made on a desktop. Only 20% were made on mobile devices. So if people spend more time on their phones, why do they convert so much more on desktops?
What caused the gap in conversions?
On average, the screen size of a mobile device is just 4.7 inches, while the typical screen size for a desktop is 15.6 inches. Correlation doesn’t always mean causation, but hypothetically, we can guess that this means that size does matter when it comes to screens and conversion rates. The percentage of conversions on mobile devices are most likely made on sites that are optimized for mobile devices because they will have the most ease of use for someone ordering on a smartphone.
Desktop conversions, on the other hand, are higher than smartphones perhaps because of the size of their screen being about three times larger. The next question we can ask is how desktops and mobile devices move their leads through the sales funnel, respectively.
What does the conversion funnel look like for each device?
When looking at the conversion funnel for both desktops and mobile devices, we can see clearly that mobile devices are used more for searching and not for purchasing.
Interestingly, nearly the same amount of products is viewed per session both on a desktop and a mobile device. But the numbers start to differ when looking at basketed products in ecommerce, specifically. On a desktop, 13% of the viewed products are basketed, whereas on a mobile device only 10% are basketed.
We can interpret this in a number of ways. First, it could mean that users shopping on a mobile device would rather convert on a larger screen than their small device. Second, it could mean many websites simply aren’t optimized for smooth mobile purchasing.
Third, it could also mean consumers tend to trust their desktops more than their smartphones when money is involved. As far as purchase rate, desktops have 11% while mobile devices have 8%. That’s not a wide gap, and if mobile usage continues to grow, those stats could flip-flop in the future!
Overall, we can assume that the reason mobile converts at a lower rate than a desktop is because of screen size. We can also attribute this difference to the fact that many websites might not be optimized for mobile, making it harder to convert on a mobile device anyway.
Do your customers buy on desktop or mobile?
Do you typically buy things on your smartphone or your desktop?
What about your customers? Let us know in the comments below!
-
 Sam has been writing for WebFX since 2016 and focuses on UX, crafting amazing website experiences, and digital marketing In her free time, she likes to spend time on the beach, play with her cats, and go fishing with her husband.
 -

WebFX is a full-service marketing agency with 1,100+ client reviews and a 4.9-star rating on Clutch! Find out how our expert team and revenue-accelerating tech can drive results for you! Learn more
The Internet in Real Time
Ever wonder how much is going on at once on the Internet? It can be tough to wrap your mind around it, but we’ve put together a nice visual that’ll help! The numbers show no sign of slowing down either.
Find out More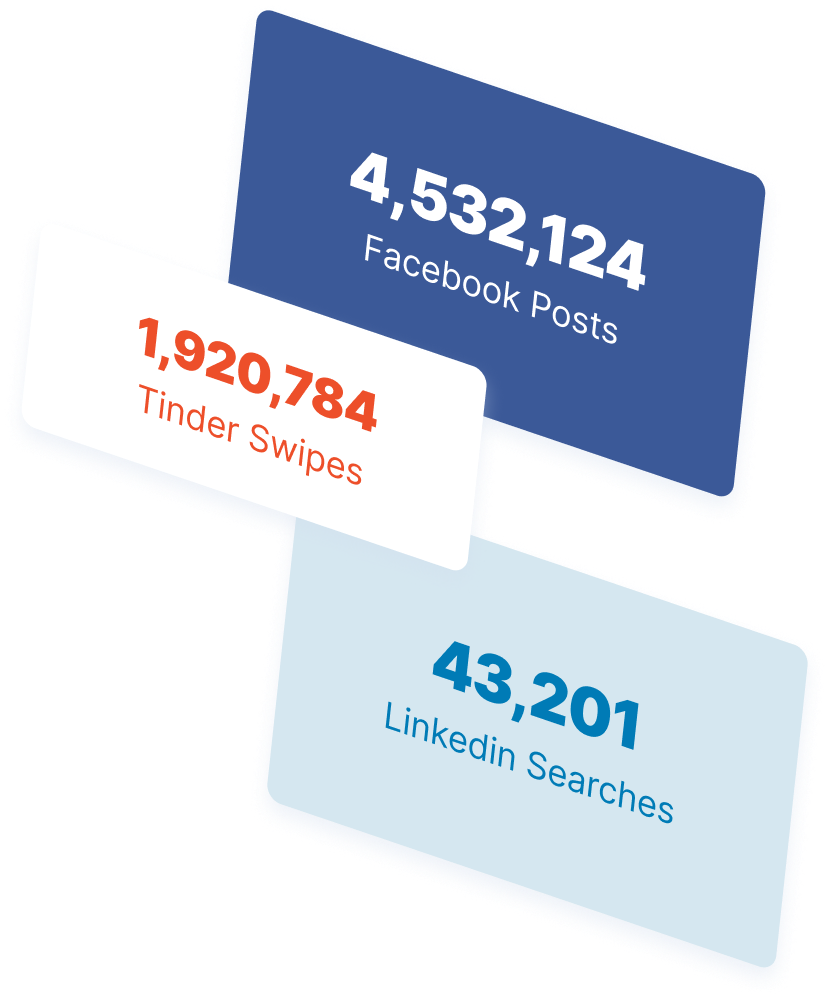
Share this article

Ready to Drive Results for Your Business?
See how WebFX uses SEO, PPC, Social Media, and Web Design to Drive Revenue for Businesses.
Get InspiredThe Internet in Real Time
Ever wonder how much is going on at once on the Internet? It can be tough to wrap your mind around it, but we’ve put together a nice visual that’ll help! The numbers show no sign of slowing down either.
Find out More