How can you tell if your giveaway or contest on social media is doing well? While there are very sophisticated tools and methods to calculate social reach and impact, you may just need a simple, high level estimate. So here’s a really simple success metric to use: the percentage of your fan base entering your giveaway or contest. 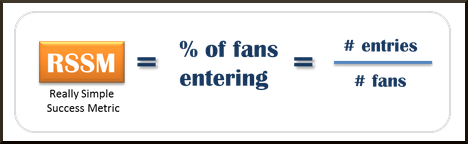 Here’s an example.
You run a Facebook giveaway asking fans to comment on a post to enter. You get 342 entries and have 1350 fans. Your really simple success metric (RSSM) is 25%. If you run another Facebook giveaway later, after your fan base grows to 1800 fans, and you get 360 entries, you might think the second giveaway was more successful due to the larger number of entries. However, with the RSSM, you’ll find that you had a 20% entry rate, meaning it was not as attractive as the previous one.
You can also compare your results with those of other similar social media pages. Just look at their giveway and calculate their success metric. Here’s an example: 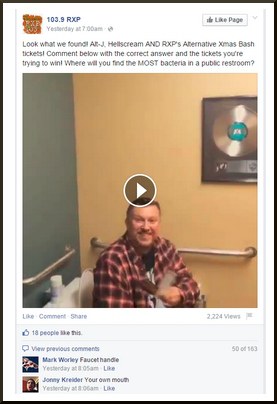 This radio station received 161 comments on their “Guess the Most Bacteria Spot” promotion.
With 9050 fans, their RSSM was 1.7%. It’s that simple, right?
OK, It’s Not That Simple
A 1.7% RSSM does not seem that exciting, and in reality many campaigns I’ve looked at have an RSSM lower than 1.0%.
Is that bad? Well, if we’re talking about Facebook, you’ve got to factor in that your organic reach on Facebook has decreased dramatically. Today, organic reach is said to average between 2-5% of your fans in many cases!
So let’s make a little adjustment to the RSSM to factor that in. Say you assume that your organic reach is 3%. Then you can calculate a Simple Success Metric, or SSM, by only factoring in the 3% of your fan base that actually saw the giveaway post.
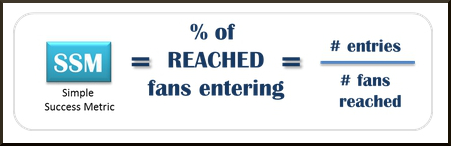 In the example above, 3% of 9050 is 272. With 161 entries, their SSM is 59%! Now that’s a successful promotion. You could use the number of views as an alternate SSM.
In the post above, you can see that the number of views is 2224. This means an SSM of 7.2%. 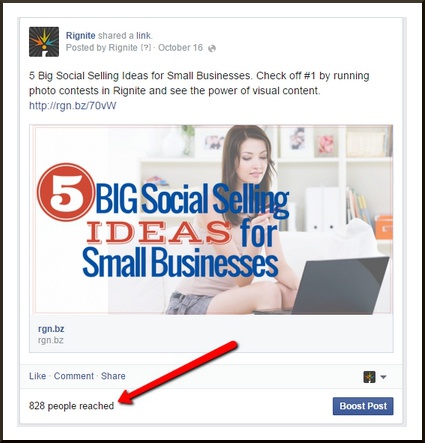 If you really want to be accurate, you can look at your post in Facebook and see how many people were reached, at the bottom left. Use this number to calculate your SSM.
It doesn’t really matter which method you use, just be consistent so you compare apples to apples. Let’s take a look at another example. This dentist’s office ran a “Guess the Grin” comment to win promotion, getting 56 comments.
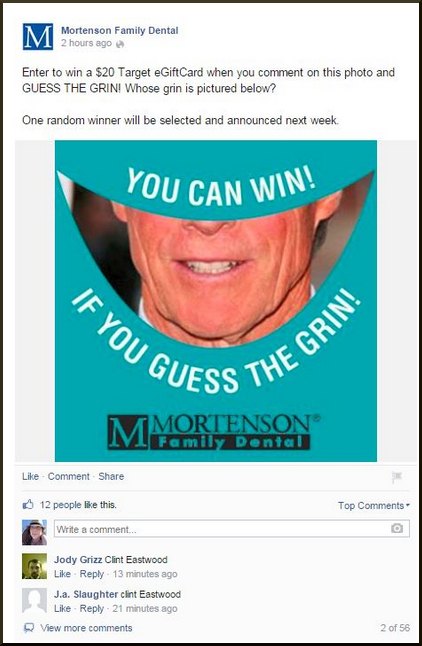 With 56 comments and 11,405 fans, their RSSM is a measly 0.5%. However, using a 3% organic reach estimate, the SSM is a more respectable 16.4%.
What About Twitter?
On Twitter, you can also calculate the RSSM and SSM for hashtag campaigns.
OTE Sports ran a tweet and follow promotion and got 34 entries. With 1316 Followers, their RSSM is a respectable 2.6%. 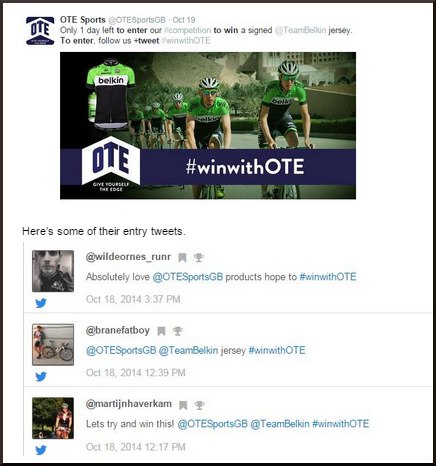 To calculate the SSM on Twitter, you can get a good estimate of reach from the Impressions reported in Twitter advertising analytics.
Just go there, even if you don’t advertise on Twitter, select Tweet Activity under Analytics, and view the impressions for your tweets.  If the OTE Sports giveaway tweet got 150 impressions, their SSM would be 23%. If you’re planning on running a promotion on Twitter or Facebook, you can use a tool like Rignite to run a campaign to automatically schedule posts and collect the entries.
This will give you campaign level analytics which can be used to calculate your RSSM or SSM.
But What About Ad-Supported Campaigns?
What if a campaign is boosted by an advertising budget? Is this unfairly increasing the RSSM?
What about ROI? When you look at public campaigns from other companies, it’s difficult to know which campaigns have been boosted with advertising money. However, for your campaigns, to get a true sense for how successful your ad-supported promotion was, you’ll need to augment the really simple success metric with a cost per entry metric.
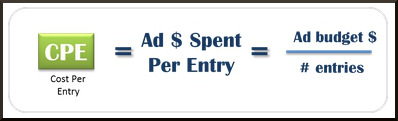 For example, if you spent $100 and you got 25 entries, your CPE would be $4. Your overall success metric is therefore 25% RSSM at $4 CPE. Compare that to 20% RSSM at $0 CPE, or 30% RSSM at $3 CPE, and you can get a rough idea of which promotions are working better than others. If you’re really good (or lucky) you could have a successful promotion that went viral, resulting in a 150% RSSM at $0 CPE.
How is that possible? As people share, like, comment, and retweet your promotion, others outside your fan base get attracted to participate. Their friends and followers see the promotion and want to join in on the fun.
While there are many other more sophisticated ways to measure success and ROI for social media activities, RSSM, SSM and CPE are good starting points. Thanks to Glen at Rignite for contributing today’s guest post! Photo credit: reynermedia
-
 Glen Kosaka is VP and General Manager at Rignite. He’s the guiding force behind Rignite’s mission to help businesses grow through social media.
 -

WebFX is a full-service marketing agency with 1,100+ client reviews and a 4.9-star rating on Clutch! Find out how our expert team and revenue-accelerating tech can drive results for you! Learn more
Twitter and Facebook Status Generator
Finding engaging social media content for your business can be difficult. Use our tool to quickly find ideas and post directly to your page.
Give Me an Idea
Share this article
Social Media Cost Calculator
Use our free tool to get a free, instant quote in under 60 seconds.
View Social Media CalculatorTwitter and Facebook Status Generator
Finding engaging social media content for your business can be difficult. Use our tool to quickly find ideas and post directly to your page.
Give Me an Idea