Infographics are an essential content marketing and data-visualization tool. Graphics made up of visually compelling elements and scintillating data – what’s not to love? As a society made up of visual learners, it’s no wonder that infographics quickly found a place in the online marketing hall of fame.
However, that doesn’t mean that every infographic ever created has been a home run — quite the opposite, actually. While this content marketing strategy might not be a fit for every business, it isn’t limited to certain industries, either. With the amount of infographics on the web today, it isn’t possible to simply throw one together and gain instant viral success.
To create a successful infographic, you must strategically plan, research, design, and promote with specific goals in mind. Whether your industry is considered boring or the most interesting, the key to conceptualizing and creating successful infographics lies in these five steps:
- Topic Discovery
- Research
- Design
- Promotion
- Evaluation
If you’re thinking that the above steps are a no-brainer, you might be right. However, we might have a trick or two up our sleeves. Let’s explore the five step process and learn how to create an infographic that will bring you online fame and glory.
Finding Your Topic
Zeroing in on a topic is by far and away the most challenging part of the infographic process.
This part of the process actually involves several smaller steps. First, it’s important to consider your goals for the infographic. Will this be a branded infographic used mainly as a marketing tool? Or will it be a link building tool used to build awareness and authority for your site?
Determining the overall marketing goals for the piece of content is the first step. Second, consider your target audience. Are you aiming for the elite blogs and publications in your industry? If so, don’t hesitate to create a wishlist of sites you’d like to publish your infographic.
Creating this short list will help tailor your research to the right audience. Now that you’ve got step one and two figured out, it’s time to dive into topic exploration.
Topic Exploration
Say your business is in the hospitality industry and you aren’t sure what topic will land you viral success. There are some wonderful tools that can identify the topics in your industry that will attract your target audience.
Use Google Trends to research search trends related to your industry. The tool can also be used to compare interest over a variety of different terms. For example: restaurant, travel, and vacation are all terms associated with the hospitality industry.
Use this tool as a way to gauge interest in terms and potential topics. 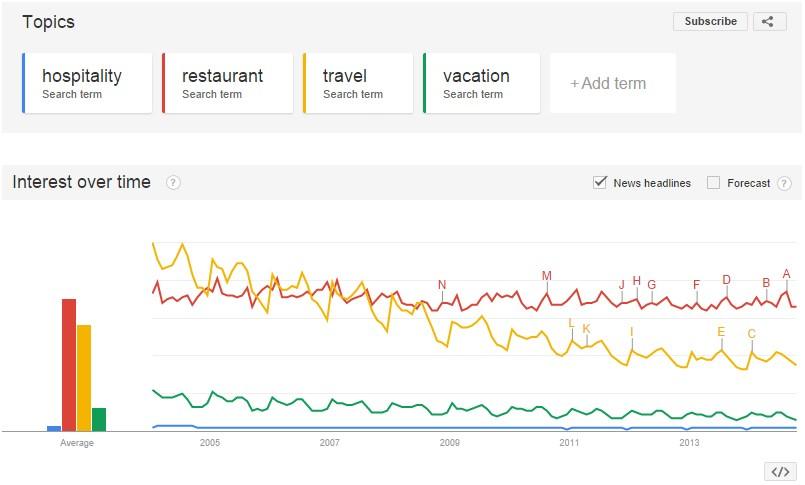 Once you’ve zeroed in on some terms for research, use tools like Buzzsumo to identify popular topics and content. This tool compiles social data on specific domains, topics or keywords, and organizes the results by platform.
For an in-depth look at all of Buzzsumo’s awesome features and capabilities, click here. 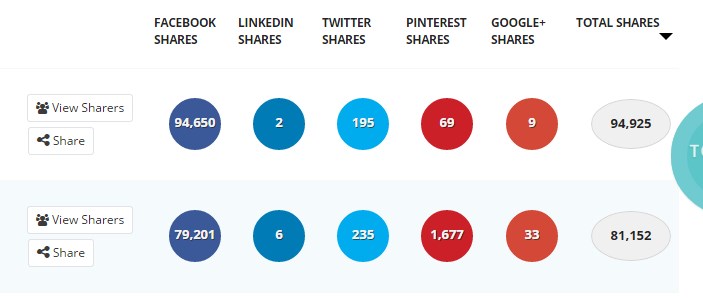
Research
The key to successful research is understanding what type of infographic you’re trying to create. Does your topic rely on a strong data set that can be easily visualized with graphic elements, or does your topic require a narrative that would be best explained through a well-organized storyboard?
Answer these questions before you jump into the research process.
Develop a Clear Thesis
Sometimes it’s best to approach research the old fashioned way. We like to take a mini flashback to our college days and create a thesis for our infographics. This 2-3 sentence statement announces the objectives of the infographic, which helps to make research a breeze.
To determine if your thesis is a winner, remember to focus your research towards an angle that’s interesting to the average viewer. Additionally, a great thesis can be supported by:
- Easily-visualized data
- Statistics
- Facts and figures
Consider Your Audience
Now that you’ve developed a clear thesis, determine if the tone and direction of the infographic is a fit for your target audience. Keep an eye out for bloggers and sites that have covered the material in your infographic. If appropriate, don’t hesitate to use their research in the infographic, but be sure to credit the site as a source.
By using a specific site as a source, you’ve created a greater chance for that publication to share your content.
Dig Deep
Research can sometimes be a wild goose chase. At times it will lead you straight to the pot of statistical gold, other times you’ll feel like the internet just chewed up your great idea along with all of your self-confidence. To prevent this, create an outline of the type of information you’d like to find in your research.
- What are you trying to prove?
- What questions immediately come to mind?
- How would you like the data visualized?
This outline will help organize the most important points in your research. After you’ve identified the essential points, use them as the foundation of your research exploration. There are a few go-to resources I start any infographic research with.
Reddit Datasets, Data.gov and Topsy are among my favorites. However, I’m partial to any resource that offers a well-researched dataset that is relevant to my topic. 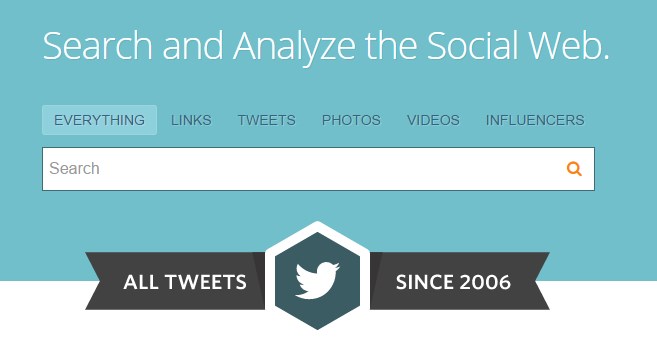 Cut it down to essentials.
You’ve spent a significant amount of time collecting data and research to support your infographic thesis. Now is the time to condense and organize the research into a layout that is conducive for the design process. Whether you’re designing in-house, using an award-winning agency, or outsourcing to freelancers, having an organized research document will help to ensure a design that is not only stunning, but clearly represents the information.
This draft should be edited for clarity, flow, grammar, and spelling, and should be considered the final copy that will be included in the infographic. Any superfluous information should be omitted at this step. Pro Tip: Don’t forget to give credit where credit is due! Listing the reputable sources you used in your content will go a long way when trying to promote the infographic.
Design
Design, aka where the magic happens in the infographic creation process.
Unless you’re a super talented content marketer, SEO expert and graphic designer, chances are you won’t be tackling the design step of this process yourself. However, that doesn’t mean your role in the project is over! There is still plenty to oversee during the design process. Ultimately, the most important aspect of the design process is data visualization.
Data Visualization
If the infographic research contains strong data sets, statistics or figures, finding the most accurate way to portray that data is important. Don’t rely on a pie chart to track quarterly ROI over a two year period, use a bar graph.
Understanding the data is the first step to designing it correctly. Data visualization tools can be used to easily identify trends in an instant. You want your research to be understood just as easily.
If creating award-winning design isn’t really your thing, we can help you with that! You can also use oDesk and Dribbble to research freelancers based on skill set and budget.
Promotion
Your content isn’t going to go viral on its own. Get your infographic in front of as many eyes as possible with a strong promotion strategy.
Before publishing the infographic, strongly consider writing a short blog post, about 450 words, to tease your infographic. Give your audience a short overview of the type of information they can expect to find in the infographic. In order to make your infographic as easy to share as possible, be sure to include an embed code at the bottom of the post.
Don’t know how to create an embed? Don’t fret! This handy embed code generator will do all the work for you.
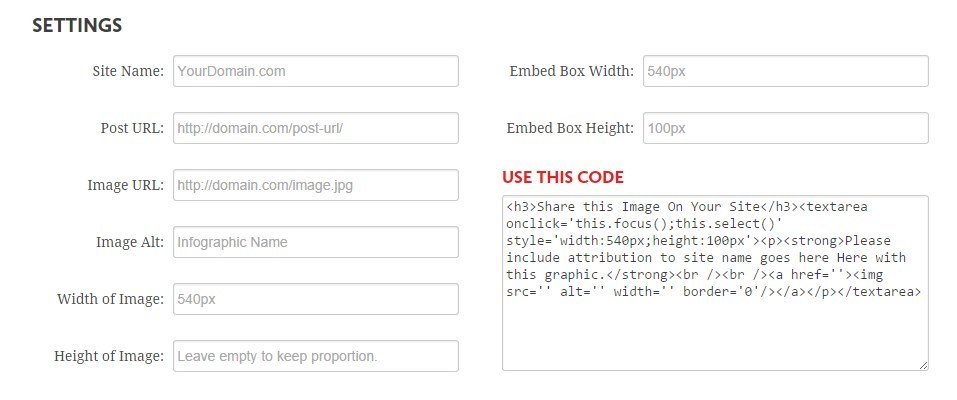 Pro Tip: Be sure to test the embed code before publishing to ensure the code is working properly. Time to get social! You’ve spent a significant amount of time creating this piece of stellar content.
Now’s the time to be proud and get social! Promote your infographic by publishing to sites like Twitter, Facebook, Reddit, and StumbleUpon. Speaking of stumbles, consider taking advantage of StumbleUpon paid discovery.
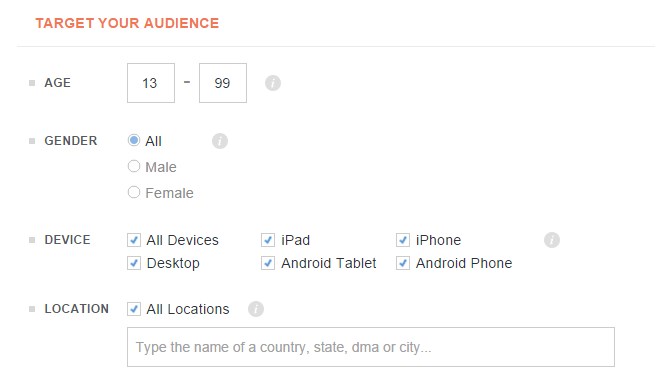 This tool creates targeted content distribution based on your campaign requirements. Paid discovery allows you to choose your target demographic, locations, devices and specific interests that relate to your content. You can then set a daily budget, price per stumble and campaign schedule.
Sit back and watch the visits roll in: 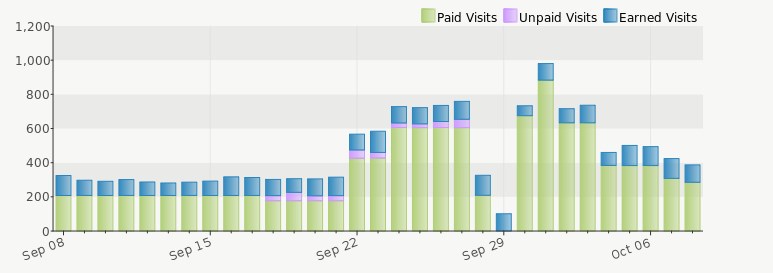
Submit to Infographic Directories
Submitting to infographic directories is a great way to start your link building campaign by gaining links from reputable sites. Here are a few sites that accept infographics:
- Visual.ly
- Flickr
- Daily Infographic
- Infographics Archive
- Cool Infographics
- Infographic Journal
Pitching Your Infographic
After you’ve spent time conceptualizing, researching and designing your infographic, you’re going to want to share it with the world. The promotion step of this process requires a killer pitch. Develop a list of strong prospects that would be willing to share your content.
Building out your pitch list can sometimes be a laborious process, but it pays off in the end. Identify bloggers, sites and reporters that cover the subject matter included in your infographic, then proceed to find their contact information, social network profiles, and don’t be afraid to learn a little about them. Next, reach out to these key influencers in your industry and offer up your content in a customized pitch.
Brevity is Key: Keep Your Pitch Email Short and Successful
The journalists and bloggers that you’re pitching are busy people.
The last thing they need is another lengthy pitch email flooding their inbox. The most successful pitch emails are concise, personalized, and clearly highlight benefits. Use this magical 5 point pitch email template as your guide:
- “Let me get straight to the point.” Include a strong opening that succinctly explains why you’re contacting the blogger or editor.
- Time to get personal: Offer up an explanation of who you are, where you write, and any credentials to establish yourself as an expert in the industry.
- What’s in it for them? Use a sentence or two to explain the infographic and why it would be a perfect fit for their site.
- Flattery or critique: End your email with either genuine flattery of their work, or explain how your content is expanding on a topic that is lacking on their blog.
Small Fish Like Great Content, Too!
Make sure to reach out to the smaller sites and bloggers in your target audience. Automating this second round of promotion will save time, and is the most efficient option for maximum exposure. Create an email template for each category in your infographic. For example, if your infographic explores the recent Ebola outbreak, relevant categories would include health, wellness, news, and even politics.
Organize your pitch list by category and email bloggers using the corresponding template. Pro Tip: Always include the blogger or reporters name in your greeting. Most bloggers will immediately trash a pitch with a salutation that doesn’t even include their name.
Evaluation
What’s the point of creating this killer piece of content if you don’t measure your success?
Take a look at your Google Analytics account to assess the infographic’s success. 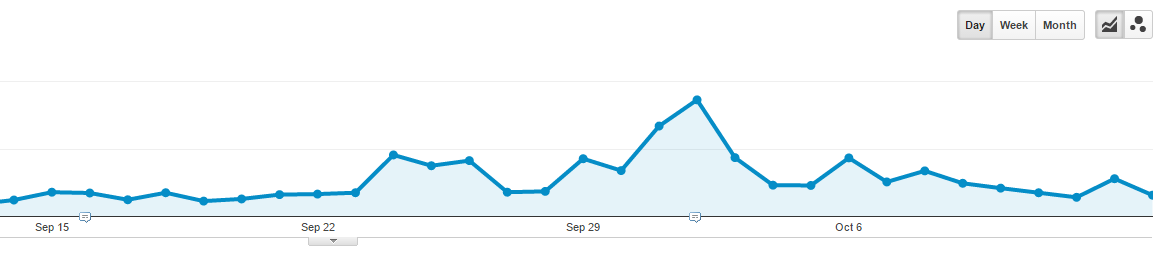 The following are a few sections to investigate:
- The number of visitors (new or returning) the day after launch.
- Take a look at the referral traffic to determine what traffic is a result of the infographic promotion. Identify which sites are sending traffic your way.
- Are social sites (Facebook, Twitter, etc.) sending any referral traffic your way? If so, record the increases.
- Compare visits, unique visitors, pageviews, visit duration, and bounce rate against the previous month. How do they match up? If everything goes well, you’ll see a nice increase in traffic compared to previous months.
Finishing Your Journey
That’s it! You’ve reached the end of this infographic journey! In summation, you’ve conceptualized a killer topic, became an industry expert through in-depth research, oversaw a stunning design, promoted the heck out of your content, and reviewed the numbers to ensure everything went swimmingly.
Well done! I hope this tutorial has helped you learn how to create an infographic, and also given you some tips to use when promoting your creation to others. Although this process is really anything but simple, with clear objectives and solid strategies in mind, creating thoughtful content to promote your business can be an extremely rewarding process.
Have a question, or want to share your own infographic tactic with our readers? Reach out to us in the comments section below! We can’t wait to hear from you!
-
 The WebFX team is made up of more than 450 subject matter experts in digital marketing, SEO, web design and web development, social media, and more. Together, they’ve helped WebFX’s clients earn more than $3 billion in revenue from the web — and that’s just in the past five years.@webfx
 -

WebFX is a full-service marketing agency with 1,100+ client reviews and a 4.9-star rating on Clutch! Find out how our expert team and revenue-accelerating tech can drive results for you! Learn more
Try our free Marketing Calculator
Craft a tailored online marketing strategy! Utilize our free Internet marketing calculator for a custom plan based on your location, reach, timeframe, and budget.
Plan Your Marketing Budget
Share this article
Maximize Your Marketing ROI
Claim your free eBook packed with proven strategies to boost your marketing efforts.
Get the GuideTry our free Marketing Calculator
Craft a tailored online marketing strategy! Utilize our free Internet marketing calculator for a custom plan based on your location, reach, timeframe, and budget.
Plan Your Marketing Budget