- Home
- Blog
- Search Engine Optimization Google Analytics Multi-Channel Funnel Survival Guide
Google Analytics Multi-Channel Funnel Survival Guide
-
 5 min. read
-
 WebFX Team
 Digital Marketing Agency
- The WebFX team is made up of more than 450 subject matter experts in digital marketing, SEO, web design and web development, social media, and more. Together, they’ve helped WebFX’s clients earn more than $3 billion in revenue from the web — and that’s just in the past five years. @webfx
There are usually just a handful of announcements in a given year with the ability to change the entire Internet marketing world. The release of the Multi-Channel Funnel Reports in Google Analytics is definitely worthy of one of these titles. After researching and testing this incredible idea out single-handedly, the next step was picking my jaw off the floor.
This particular report allows you to see the entire path individual users have taken on their way to completing a goal or conversion on your site, rather than just the most recent referrer. For starters, let’s check out some features. After logging into your Google Analytics account and clicking on “Multi-Channel Funnels” under the “My Conversions” tab, you will be presented with an overview screen providing data such as the number of conversions acquired and what specific channels “assisted” these conversions.
In the past, conversion was credited to the most recent search or advertisement prior to the conversion. The game of Internet marketing is now changing. When your favorite football team scores a touchdown, do you give credit solely to the wide receiver who caught the pass?
What about the quarterback who threw the ball? Or the offensive lineman who made the block? I’d sure hope not.
The touchdown is a result of each team member contributing for the betterment of the collective squad. These “assisted conversions” are similar in that we can now gain an understanding of the many aspects contributing to an individual conversion. Below you can find a Venn Diagram, provided by Google, presenting the distribution for the different conversion paths found in the overview section of Google Analytics.
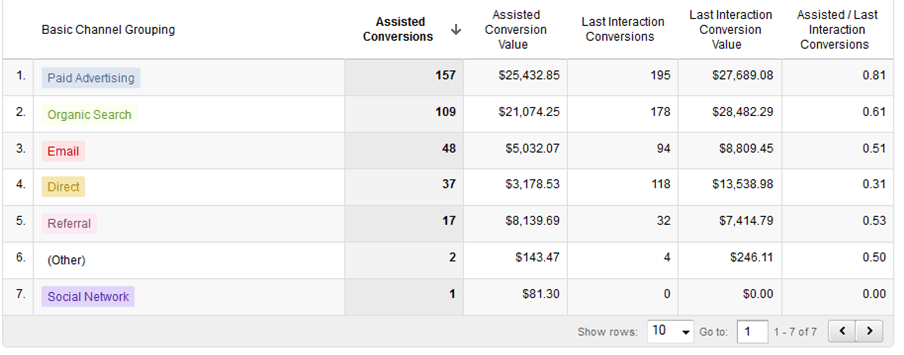
Access to this information is significant because it gives you considerable insight as to how many interactions go into a single conversion. 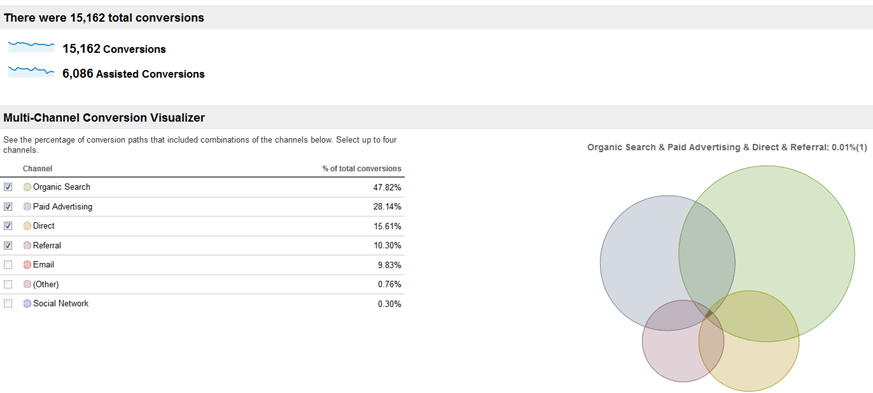 Moreover, by using the “Assisted Conversions” section, you are able to drilldown to find the necessary information to see which campaigns and channels are assisting the conversions and how. For a quick example, let’s take a look at the “Assisted/Last Interaction Conversions” metric.
Numbers close to zero indicate the channel typically closes more than it assists. If the number is close to one, however, that channel closes and assists sales at a more equal rate. Knowing these numbers essentially allows you to assign roles to the different medium.
 The “Time Lag” section allows you to have the ability to see the amount of time in days between when users experience their first interaction all the way to the final conversion. You would be surprised at the number of users whose time lag is greater than ten days!
  Google also includes a “Path Length” section that very closely resembles the “Time Lag” section.
The difference lies in the “Path Length” section providing insight into the total number of user interactions by channel. Understanding this allows you to see if the last advertisement or search click should really be given all the credit, or if it was the result of a long line of interactions (perhaps the wide receiver should have been given all of the credit after all!). My personal favorite segment of this Analytics data tool is the “Top Conversions Paths”.
In this section, you can easily find the different routes users traveled to complete a goal or conversion. Maybe they first searched three weeks ago, clicked on a paid advertisement four days ago and finally converted today by directly typing in your domain name! All of this information and more is provided to you!
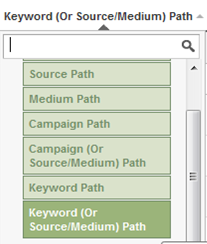
 You can get even more specific by finding the keyword searched for by clicking the “Keyword (Or Source/Medium) Path” as follows:
  Still with me? I’m almost done. But now comes the coolest part!
You can create custom segments to better understand the conversion paths of your visitors on several different levels. Maybe individuals are initially coming to your site by searching for the top warranties for products similar to the ones you offer. In the past, you may not have been aware that this particular keyword initiated the process!
The amount of segmentation groups seems to be endless. In the following illustration, I wanted to know the number of users who started their conversion process by searching for [Example Warranty] and purchased a product that costs $130 or more, all while taking five days or more to go from the first interaction to the final conversion: 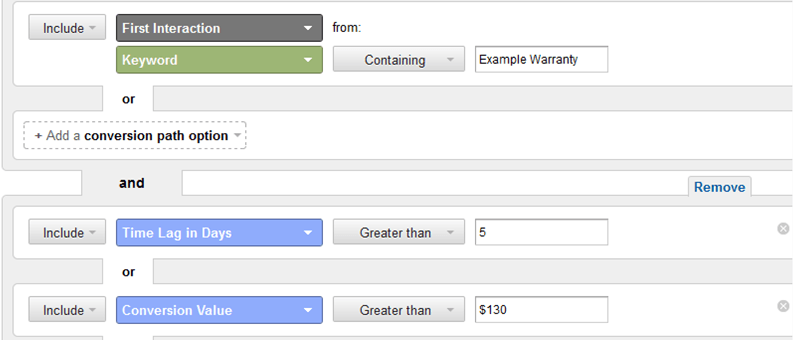 While this post gives you insights into some of the features, it is only the tip of the iceberg. Since Google “Multi-Channel Funnels Report” provides a great opportunity to better optimize your different Internet marketing channels to achieve optimal conversions, the best way to learn more is to test it out yourself.
Now you can accurately infer who really deserves the credit for that touchdown. Happy testing!
-
 The WebFX team is made up of more than 450 subject matter experts in digital marketing, SEO, web design and web development, social media, and more. Together, they’ve helped WebFX’s clients earn more than $3 billion in revenue from the web — and that’s just in the past five years.@webfx
 -

WebFX is a full-service marketing agency with 1,100+ client reviews and a 4.9-star rating on Clutch! Find out how our expert team and revenue-accelerating tech can drive results for you! Learn more
Try our free Marketing Calculator
Craft a tailored online marketing strategy! Utilize our free Internet marketing calculator for a custom plan based on your location, reach, timeframe, and budget.
Plan Your Marketing Budget

Looking for More?
Get expert ideas, industry updates, case studies, and more straight to your inbox to help you level up and get ahead.
"*" indicates required fields
Try our free Marketing Calculator
Craft a tailored online marketing strategy! Utilize our free Internet marketing calculator for a custom plan based on your location, reach, timeframe, and budget.
Plan Your Marketing Budget

